1.0 Introduction
Real Estate endeavor provides housing, which is one of the most crucial needs for humanity. Analysis of real estate data is of importance to both businesses and customers. For companies operating in the housing sector, this topic enables them to gain crucial insights into pricing strategies, market trends, and establishing investment policies. Investors can decide where to invest their funds by analyzing housing factors such as location, number of rooms, and historical price data. Business professionals in real estate can utilize this data to predict and adapt to the shifting market conditions, maximize their returns on investments, and optimally build their portfolios.
On the other hand, customers can also benefit from this analysis. Potential homebuyers and sellers can employ insights from this analysis to make crucial decisions. They can evaluate the property’s market value, have sufficient bargaining power, and make decisions that align with their financial objectives. Therefore, insights from this analysis bring honesty and transparency to the real estate sector, impacting customers with the expertise required to make crucial financial decisions, such as buying or selling a house.
1.1 Objectives of the Study
i. To determine the average prices of houses in different cities in Washington State.
ii. To determine the average prices of houses based on square feet of living space.
iii. To investigate the average prices of houses based on the number of bedrooms and bathrooms.
iv. To predict the average prices of houses in Washington State.
1.2 Hypotheses
i. Different cities in Washington State do not affect the average prices of houses.
ii. Square feet of living space do not affect the average prices of houses.
iii. The number of bedrooms and bathrooms does not affect the average prices of houses.
This study will analyze the housing data provided to determine the average house prices. The hypothesis present will be tested, a literature review and methodology developed, a correlation matrix created, regression analysis conducted, findings will be discussed, and conclusions and recommendations derived.
2.0 Literature Review
The News Tribune article by Jared Gendron (2023) shows that Medina town is the most expensive city in Washington State, with the property selling average at $ 8,585,489. The town is located on the eastern shore of Lake Washington, King County. Being a suburb of Seattle, Medina is home to over 3,200 people. Since Medina is recognized as an excellent destination for people, the property is acquired at very high prices.
The Seattle Times article by Jane Hodges (2016) indicated that Clyde Hill, surrounded by Medina to the west, had a population of 3,060. Since the area is close to the tech hubs, lately, people have been moving there for settlement. The region is a 30-minute drive from the capital, Seattle; hence, investors and business tycoons would consider it for accommodation. In terms of housing, Clyde Hill has numerous larger custom houses with varying architectural styles. The estimated average house value is $ 1.9 million.
According to Shakir (2020), the average price of houses in SeaTac is roughly $ 416,000. However, he stated that the prices gradually go up over the years. The article also highlights the average price per square foot as $ 264, which is lower than that of SeaTac Bellevue Metro, $ 285.
Davis and Palumbo (2008), in a Journal of Urban Economics, elaborated on the significance of residential land prices in large US cities. The two highlighted that land value plays a significant role in determining house pricing. That is, approximately 50 % of the value of housing is the value of land or, instead, the living space the house is sitting on.
Seattle house prices versus the number of bedrooms article written by MacEvilly (2022) suggests that the cost of houses in Seattle increased by $ 212,000, going from a 2 to a 3-bedroom place. Moving from a 3 to 4-bedroom house cost an additional $ 290,000.
An article by Williams (2021) suggests that when determining the pricing of houses, the quantity of bathrooms outweighs their quality. On that note, the author further advises that any individual who wants to put up his home for sale should consider adding a bathroom to increase the value of that house.
3.0 Methodology
The study’s methodology followed a systematic approach. Initially, a dataset containing 4001 rows (including the headers) and 18 columns related to real estate was collected and analyzed in Ms. Excel tool. Several activities were carried out in Ms. Excel. First, Data pre-processing, which involved the removal of null values, duplicates, and empty rows to improve data quality. Second, pivot tables were developed to summarize and analyze the real estate data, with a goal on various features, such as average monthly prices, average prices vs. the number of bedrooms and bathrooms, and average prices based on the square footage of the living space. Visualizations, including line and bar graphs and time series charts, were generated to derive insights from the real estate data. Additionally, correlation and regression matrices were formed to investigate the relationships between variables.
Four study objectives were then formulated based on the visualizations generated. Null hypotheses were also established to carry out hypothesis testing. Furthermore, background information and literature review were carried out by referencing articles and journals from credible sources such as Google Scholar to offer context and support the study. Results and discussion were presented using tables and figures from Excel, and conclusions were drawn based on the findings. Finally, recommendations were made to key stakeholders, businesses, and customers, ensuring the study’s practical value and relevance.
4.0 Results and Discussion
4.1 Average prices of Houses in different Cities in Washington State
From the graph below, the following inferences were obtained.
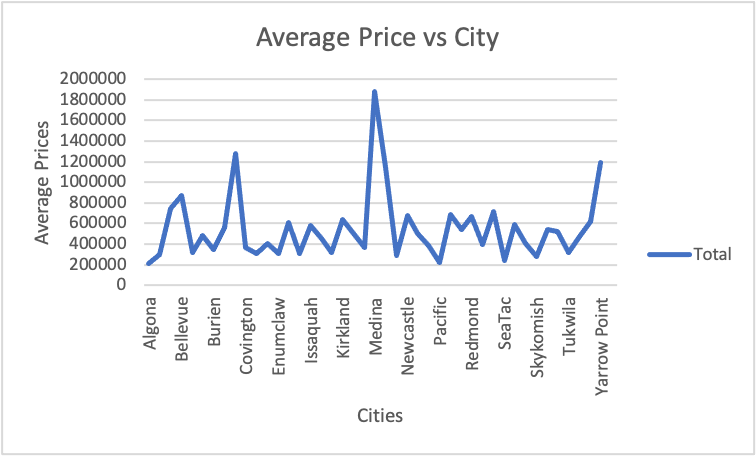
Figure 1: Average Prices vs City
Medina city recorded the highest average sales of houses, $1880215. This is in line with an article written by Gendron (2023), where he recognized Medina city as Washington’s most expensive neighborhood due to the presence of accessible social amenities like schools and also the presence of outdoor activities that bring great people from around the globe. Clyde Hill was the second highest, with $1283675 as the average price of houses. Yarrow Point came third with $1194837.5. The high average prices of homes in Clyde Hill and Yarrow Point agree with the results of Hodges (2016), where the estimated average house value is $1,900,000. Furthermore, Hodges stated that Clyde Hill and Yarrow Point are havens for wealthy, educated homeowners, indicating that residents in those areas have high purchasing power.
On the other hand, the following three cities recorded the lowest average prices of houses: Algona, Pacific, and SeaTac. The table below highlights the costs of the three cities;
Table 1: Cities with the lowest Average Prices
| Cities | Prices ($) |
| Algona | 207288 |
| Pacific | 218280 |
| SeaTac | 236997 |
The article by Shakir (2020) shows that SeaTac in Washington State has affordable housing, which is suitable for low-income earners.
4.2 Average Prices of Houses based on Square Feet Living Space
The line graph below shows the relationship between the square feet of living spaces and the average prices. Therefore, the average price of houses generally increases with the increase in the square feet of living space.
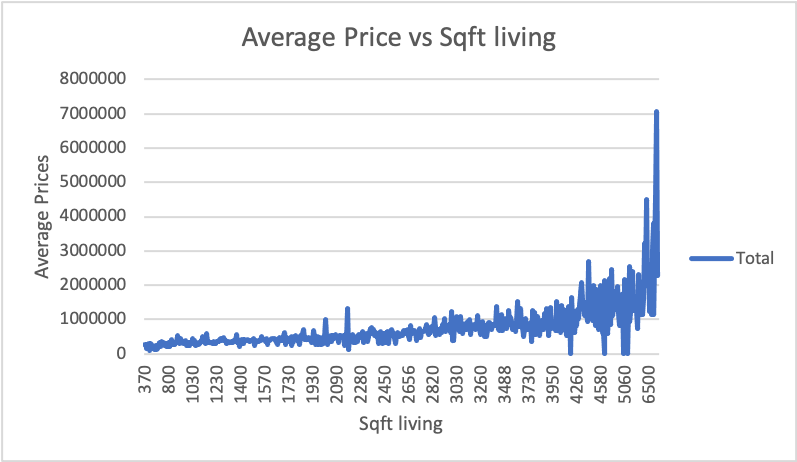
Figure 2: Average Price vs Sqft Living
The positive correlation between average prices and square feet of living space in this study is in tandem with the Journal of Urban Economics, which states that the value of housing in cities is approximately 50% influenced by the residential land value, in this case, the living space (Davis & Palumbo, 2008).
4.3 Average Prices of Houses based on the number of Bedrooms
The following observations can be made from the graph below;
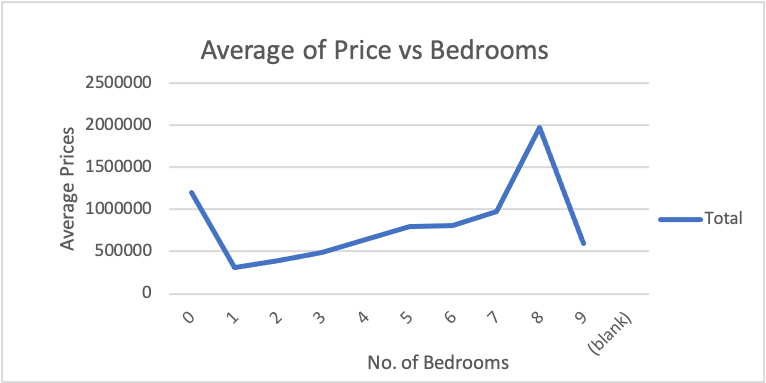
Figure 3: Average of price vs Bedrooms
There is an uptrend in average prices of houses from one-bedroom to eight-bedroom houses. This is because more resources are needed to construct more bedrooms. For instance, the number of workers, materials, and project duration, among other factors, would increase as you construct more bedroom houses, leading to a high cost of production. Therefore, to counter the high cost of producing more bedrooms, the prices of houses upon completion must be high for property owners to maximize profit. The findings concur with an article by MacEvilly (2022), where the prices of houses increase significantly with the addition of the number of bedrooms.
4.4 Average Prices of Houses based on the number of Bathrooms
The bar graph below shows a gradual increase in the average prices of houses as the number of bathrooms increases. For example, a house with 6.75 bathrooms went for $ 4,668,000. Houses with bathrooms ranging from 1 to 2.25 are affordable (that is, $ 534,000 and below).
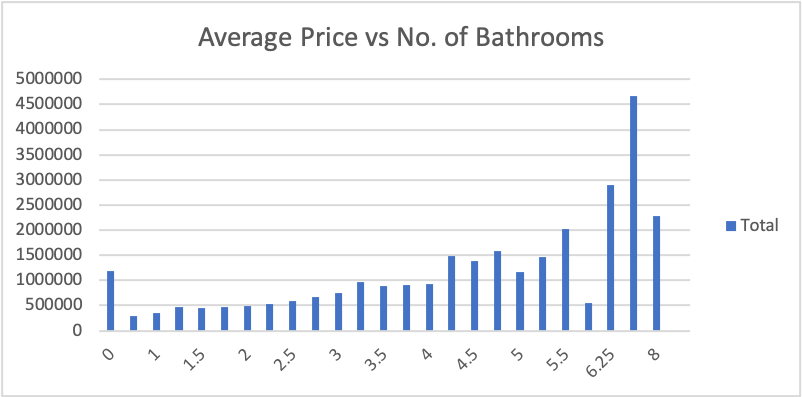
Figure 4: Average Price vs No. of Bathrooms
An article by Williams (2021) suggests that when establishing house prices, the quantity of bathrooms is more important than the quality. Therefore, based on that article and the findings portrayed by the above graph, one can deduce that the average pricing of houses increases with an increase in the number of bathrooms. The two variables are positively correlated.
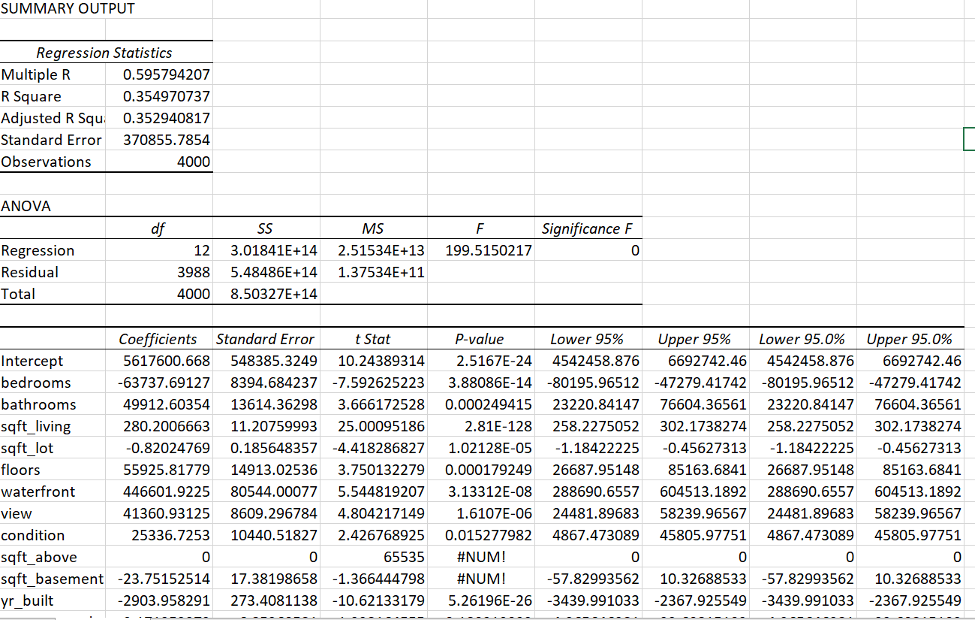
4.5 Prediction of the Average Prices of Houses in Washington State.
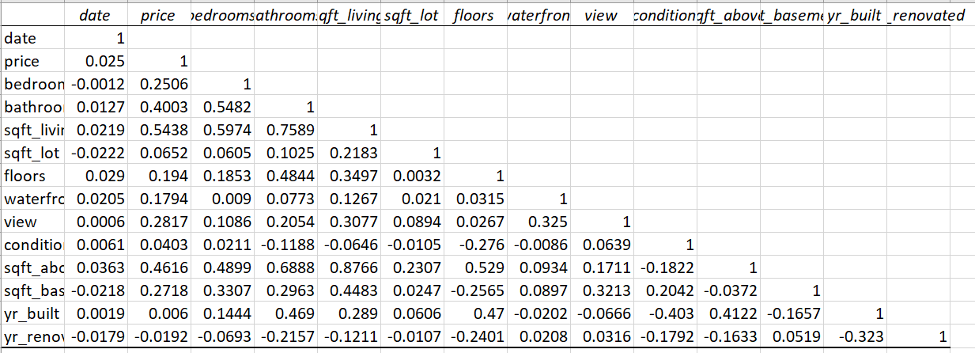
Linear regression technique was used to predict the average prices of houses based on all the numeric variables in the data, including number of bedrooms and bathrooms, sqft living, sqft lot, floors, waterfront, et cetera.
Using the data analysis tool in Ms. Excel, the following multiple linear regression was established:
Average House Price = 5617600.668 – 63737.69127 Bedrooms + 49912.60354 Bathrooms + 280.2006663 Sqft living – 0.82024769 Sqft lot + 55925.81779 Floors + 446601.9225 Waterfront + 41360.93125 View + 25336.7253 Condition – 23.75152514 Sqft basement -2903.958291 Year built + 9.171252372 Year renovated
The above equation can predict the house pricing in Washington State.
4.6 Time Series Analysis
Analysis of time was also conducted to determine the average house prices in Washington State. A line graph was plotted with the average house prices as the dependent variable (y-axis) and month as the independent variable (x-axis).
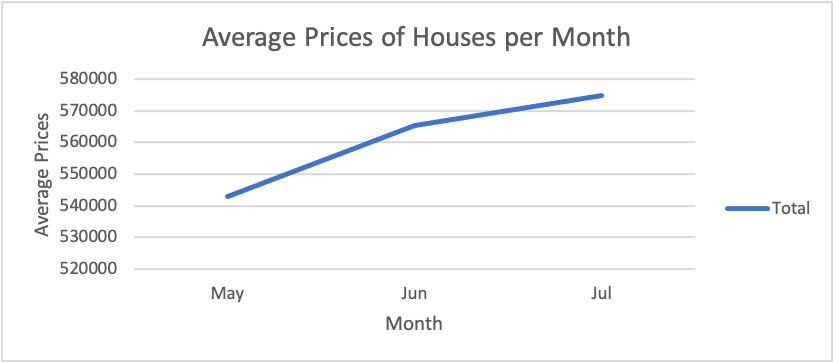
Figure 5: Time Series Chart
From the graph, one can conclude that the average house prices increase over time. This can be influenced by population growth, which increases the housing demand. Therefore, the state needs to build more houses to level off the prices (Santarelli, 2023).
5.0 Conclusion
Analyzing housing data to determine the average house prices has produced invaluable sights in the real estate industry, offering vital information to sector professionals and customers. Through a detailed investigation of the dataset containing 4001 rows and 18 columns, including the square foot living space, bedrooms, location, and bathrooms, the study successfully attained its objectives and rejected all the null hypotheses.
Various activities were carried out: data pre-processing, which involved the removal of null values, empty rows, and duplicates. The process enhanced the quality and dependability of the dataset.
Pivot tables and visualizations created gave a comprehensive view of the housing market. Additionally, various analyses such as regression, time series, and correlation matrix helped the parties understand how attributes such as bathrooms, bedrooms, and different square feet affect housing prices.
Hypotheses formulation and references from credible sources also contributed immensely to the findings. This study offers a crucial background for informed decision-making in the housing industry, enabling businesses to adapt to market dynamics, optimize their portfolios, and maximize profits. At the same time, it enables customers to formulate well-informed choices when buying or selling their properties, assuring favorable transactions and fair market prices.
5.1 Recommendations
1. Businesses should emphasize using data-driven insights to make better policies, identify opportunities, and enlarge their business portfolio.
2. Both businesses and customers should use advanced machine learning techniques such as Decision Trees, Random Forest, and XGBOOST Gradient Machines to generate efficient predictive models with high accuracies and minimal errors.
References
Davis, M. A., & Palumbo, M. G. (2008). The price of residential land in large US cities. Journal of Urban Economics, 63(1), 352-384.
Gendron, J. (2023). THE NEWS TRIBUNE. https://www.thenewstribune.com/news/business/article275036526.html
Hodges, J. (2016, September 30). A quiet lifestyle in the luxurious little haven of Clyde Hill. The Seattle Times. https://www.seattletimes.com/business/real-estate/a-quiet-lifestyle-in-the-luxurious-little-haven-of-clyde-hill/
MacEvilly, C. (2022, June 22). Seattle house prices versus the number of bedrooms. MySeattleHomeSearch.com. https://www.myseattlehomesearch.com/blog/seattle-house-prices-versus-the-number-of-bedrooms/#:~:text=Homes%20with%20just%202%20bedrooms
Santarelli, M. (2023, September 14). Washington State Housing Market: Prices & Forecast 2023. Norada Real Estate Investments. https://www.noradarealestate.com/blog/washington-state-housing-market/#:~:text=Additionally%2C%20population%20growth%20is%20driving
Shakir, S. (2020, May 28). How much does a house in SeaTac, WA, cost. National Cash Offer. https://nationalcashoffer.com/how-much-does-a-house-in-seatac-wa-cost/
Williams, D. (2021, February 6). 6 Features That Determine a Home’s Final Sale Price. Money. https://money.com/how-to-price-a-home/#:~:text=If%20an%20average%2Dsized%20home
Appendix
Regression
 write
write