Abstract
This report analyzes the correlation between per hour of study and GPA, drawing findings from 193 observations. Utilizing a theory of multiple statistical analyses in R, namely, descriptive statistics histograms, scatterplots, and correlation analysis, the objective here would be to determine if there is any relationship between hours spent studying and GPA. The findings indicate a marginally significant correlation between study hours and GPA, which makes it possible to determine that increased learning positively affects a high GPA.
Introduction
Therefore, in the modern frantic educational environment where institutions, learners, and policymakers encounter enormous challenges brought about by academic dynamics, there are significant meanings associated with interdependence between study behaviors and performances. Recognizing the importance of proactive study as a core element in determining how much success is achieved, this research seeks to deduce what proportion of GPA and hours an average student dedicates per hour.
The defining motive driving this research indeed lies beneath the fact that more study time does not necessarily translate to a better GPA. This research study aims to disrupt the complex mysteries imposed on student learning behavior scholarships by revealing GPA and studying hours.
With the ever-changing college education and concentration on evidence-based approaches, understanding how study characteristics relate to success is critical. This study seeks to apply empirical data in critical analysis and interpretation, hence the aim of providing findings that can be used by learning administrators aspiring to develop evidence-guided systems and policymakers looking for policies based on facts.
This study seeks to find a balance between theory and practice by discovering factors that dictate academic performance that can be utilized in the decision-making process in education. Therefore, the outcomes of this research may provide notable inputs in favor of such discussion about student learning and performance.
Data Set
The dataset under investigation consists of 193 observations, encompassing two key variables: Hours of studies and school-weighted GPA. You can research the relationship between study routines and grades within this dataset as it offers an excellent pool of information.
The analysis starts with an exploratory look at the dataset in R, for which tools like str () and summary ( ) are applied to shed light on its structure and descriptive statistics. With the assistance of the str() function, we got information about the general structure outline presented under the variables for the dataset. Here, the type of outward variable and their dimensions are determined, along with other vital information, to provide a better organization. This step was significant in understanding what was buried behind dataset composition to facilitate easier analysis.
Also, the summary () function provided valuable statistics summaries such as measures related to central tendency (mean and median) along with variabilities like minimum and maximum plus quartiles for GPA and study hours, respectively. Through descriptive statistical analysis of these statistics, we can generate critical information about the distribution and variance in our dataset, hence a basis for research into other areas.
To sum up, the dataset is a good source of information to study how many hours spent studying determine GPA. Also, it offers an intelligent background on building arguments based on scientific research rather than liberal ideas. By critically analyzing and interpreting the dataset, this study intends to add a new dimension to the growing literature on the effects of student learning behavior on performance.
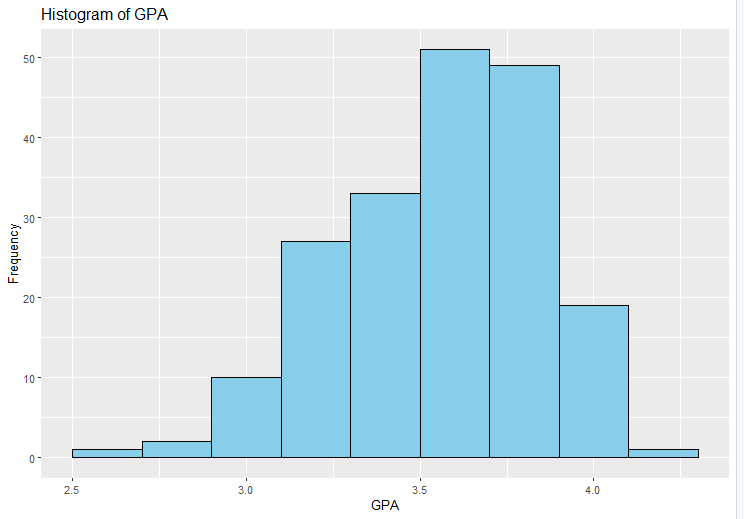
Figure 1: Histogram of GPA
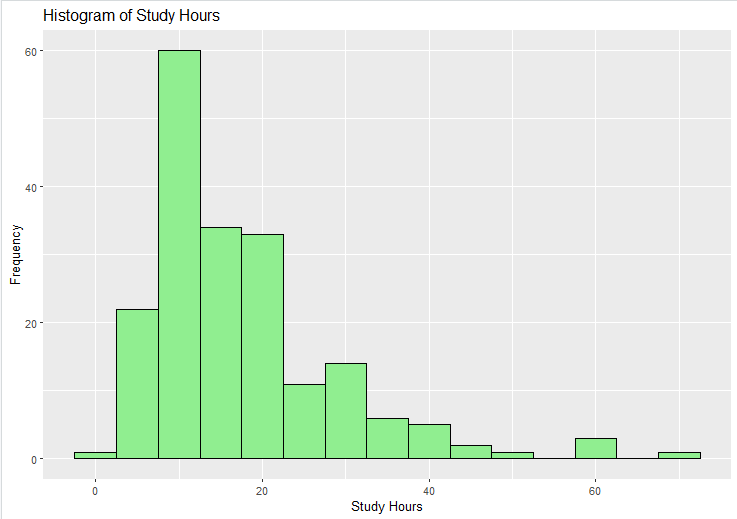
Figure 2: Histogram of Study Hours
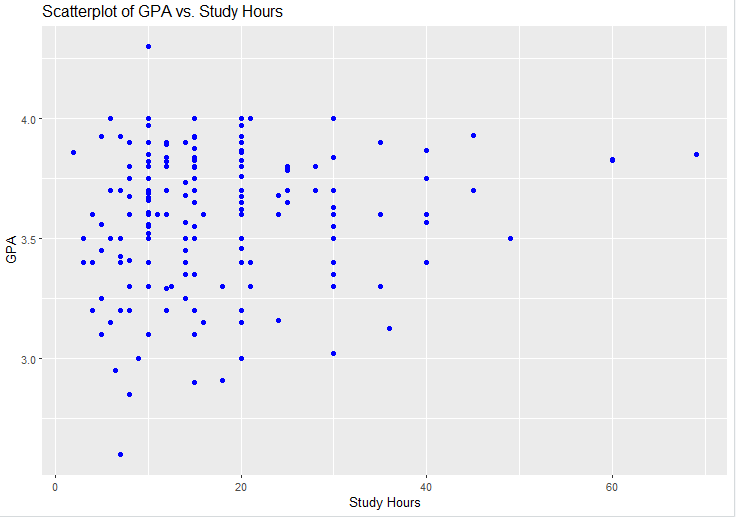
Figure 3: Scatterplot of GPA vs. Study Hours
Analysis
The analysis used descriptive statistics to indicate central tendency and variation in GPA scores as a weighted mean and GPA standard deviation across all study hours. Temporary tables provided histograms used to describe these variables’ frequency distributions, reflecting some sketchy assumptions about their width and shape. Thus, it is imperative to use a scatter plot that depicts the qualitative nature of evaluation relative to the correlation between hours spent on study and GPA. Afterward, correlation analysis was carried out to determine the relationship between the study period and GPA, as reported in Table 1 below, employing the cor() function in R.
Descriptive Statistics: Mean and median are computed for GPA and study hours as Summary statistics. The mentioned measures of central tendencies (the range, skewness ) and variability kurtosis, respectively. Statistics on mean, median minimum, and maximum, as well as Quartiles, were computed using the summary function in R. These statistics thus serve to give a snapshot of what their typical values are and just how far off from these boundaries they can get
Histograms: The frequency of the GPA and study hours produced graphics are called histograms. These histograms help present a pictorial portrayal of characteristic features about the shape and the distribution of multiple characteristics concerning the spread of nature possessed by variables. The histograms could provide, at least initially, some thought-based conclusions on the distribution of GPA and study hours, which may then be used as a starting point for further elaboration.
Scatterplot: The correlation between study hours and GPA was illustrated by a scatterplot. This pictorial representation allowed qualitative estimation of the association between the two variables. In a correlation measure known as a scatter diagram, the study hours on the x-axis and GPA to its y how could be drawn such far patterns or trends in data are found out given the nature of the relationship.
Correlation Analysis: Pearson products moment or ordinary most minor squares procedure was used to determine the power and direction of correlation between study hrs and GPA. A linear relationship between two variables can be calculated using R’s cor() function, resulting in a correlation coefficient. A positive sign for the correlation coefficient meant that a relationship between two or more variables was likely, with negative signs indicating synonymous meaning negative relationships. In addition, the statistical significance level of the correlation coefficient was also examined to determine whether there is a significant relationship between X and Y from a given standpoint.
As a step to analysis, descriptive statistics opened up the mean GPA score and study hours. Exemplary variables are applied to histograms, allowing presl’s first claims on the amplitude and sort. The scatterplot tested the linear relationship between study hours and GPA, which made qualitative valuation possible. After that, a correlation was done to determine the relationship and strength of negative between study time for GPA averages R, hence the cor() function from the base package.
Results
The analysis showed that hours spent studying were significantly associated with GPA based on a positive correlation between the two variables and had an R-value of approximately 0.13 (r = 0.13, p <. This implies that there is a weak positive correlation between the two variables. The results support that one usually gets better GPAs as study time increases, though a relatively weak correlation is observed here.
These findings offer some initial information on the correlation between study approach and academic grades concerning college students. More in-depth analysis and interpretation of the data may reveal other things, resulting in poor standing concerning what determines academic performance.
Limitations of Study
A few caveats will need to be remembered when it comes down to prejudgment results. The dataset uses only studies duration and GPA, thus ignoring confounding variables, including effective study intensiveness, student motivation, etc. Additionally, the use of self-reported hours leads to bias in data collection. Furthermore, the study is observational, so causality between hours devoted to studies and GPA cannot be derived.
Conclusion
Hence, this research shows a poor monadic relationship between study hours and GPA. It could be stronger Despite the correlation between the increased study time and achievements. Learners and educators should look at the latter in an integrationist way – with evident surrogate methods above showtimes.
References
Navarro, D. Learning statistics with R: A tutorial for psychology and other beginners. Version 6.0, University of New South Wales. http://compcogscisydney.org/learning-statistics-with-r.
Thulin, M. (2021). Modern Statistics with R: From wrangling and exploring data to inference and predictive modeling. BoD-Books on Demand.
Kvam, P., Vidakovic, B., & Kim, S. J. (2022). Nonparametric statistics with applications to science and engineering with R (Vol. 1). John Wiley & Sons.
 write
write