Geospatial Information Systems (GIS) offer valuable perspectives into the spatial dispersion of benefits and drawbacks across different locales, rendering them indispensable instruments for grasping the intricate composition of our present-day globe. This study employs geospatial information systems (GIS) to scrutinize the diverse topography of Sydney, Australia. Sydney, an international city, is distinguished by its varied socioeconomic backgrounds, vibrant urban development, and unique tapestry of cultures. As part of our effort to understand the spatial dimensions of advantages and disadvantages, we offer five maps that examine important facets of daily living in this dynamic city. Map One, which explores the spatial distribution of Sydney’s unemployment rates in 2016, is where our analytical journey starts. The intricate relationships between employment, economic prosperity, and transportation infrastructure are made clear by these maps. We use scholarly sources cited according to the Harvard referencing style to bolster our interpretations and conclusions. We hope to discover the distinctive features of Sydney’s urban environment and obtain important knowledge about the elements that influence the lives of its citizens as we make our way through these maps. We hope that this investigation will add to the conversation on urban development, spatial fairness, and the creation of a more inclusive and equitable city.
Results
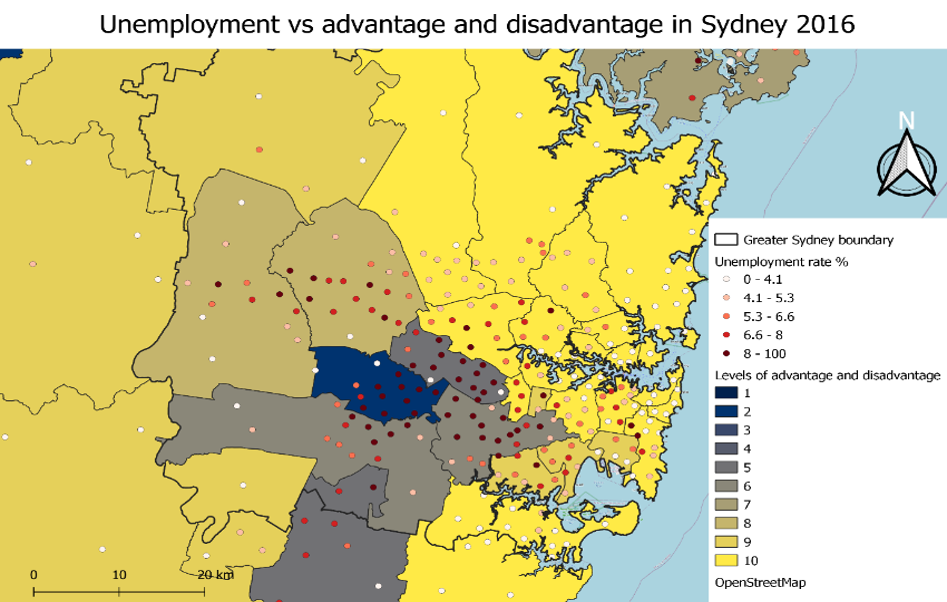
Map 1: Unemployment vs. Advantages and Disadvantages in Sydney (2016)
The spatial distribution of Sydney’s unemployment rates 2016 is graphically depicted in Map 1. This map uses a color gradient, wherein lighter colors and higher jobless concentrations represent lower unemployment rates indicated by darker colors. The map’s sharp contrast draws attention to how unevenly distributed the city’s economic chances are. The central business center (CBD) and its surrounding areas are designated with lighter hues, which indicate lower unemployment rates. At the same time, the western suburbs are clearly defined with deeper tones, which indicate elevated rates. The complex relationship between unemployment and spatial advantages or disadvantages in the city is highlighted by this difference.
These disparities in unemployment are emblematic of broader spatial disadvantage issues in Sydney. In the works of Baum, O’Connor, and Stimson (2005), Dodson and Sipe (2008), and Burke and Hulse (2015), the authors delve into the complexities of advantages and disadvantages in Australian cities. The concentration of unemployment in certain areas exacerbates problems such as limited access to public transport (Currie & Delbosc, 2011) and housing unaffordability, especially in economically thriving regions (Dodson & Sipe, 2008).
Map 2: Level of Advantage and Disadvantage of Population Born Overseas in Sydney
Map 2 shows the differences in advantages and disadvantages among Sydney’s foreign-born population. It makes use of a color spectrum to illustrate these disparities, with lighter hues denoting locations with greater advantage and darker reddish-green hues reflecting levels of disadvantage and areas with a higher concentration of residents who were born abroad suffering disadvantage. The graphic shows that socioeconomic situations are unique in places with many residents born abroad. The map’s darker tones indicate that areas with a high immigrant population also tend to be more disadvantaged.
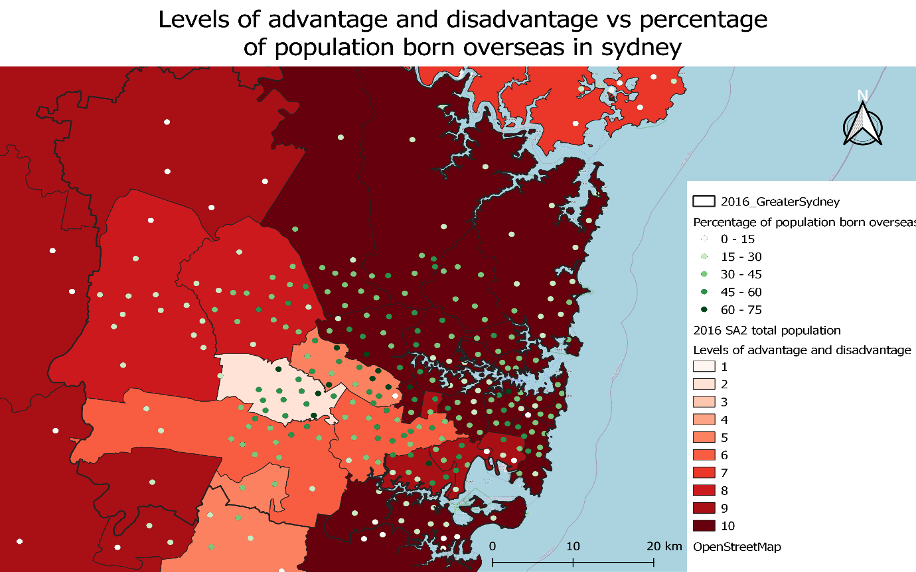
This map highlights the intricate relationship between immigration and socioeconomic circumstances. It demonstrates that although immigration increases diversity, inequities in space are not always eliminated. Even highly immigrant areas may experience economic difficulties. Transportation problems, such as restricted access to public transportation, can make life more difficult for locals in locations where a large percentage of the population was born abroad. Furthermore, the affordability of housing for both native-born people and those born abroad is impacted by the high cost of housing in economically thriving areas.
Map 3: Advantages and Disadvantages in Sydney Relative to Education Levels and Weekly Income.
Map 3 visualizes the socioeconomic disparities in Sydney, considering education levels and weekly income as key indicators. The map employs a spectrum of colors, with darker colors representing areas where residents have lower education levels and weekly incomes and lighter shades indicating regions with higher socioeconomic status. The map vividly illustrates that education and income levels are closely related to the spatial distribution of advantages and disadvantages in Sydney. Darker areas on the map highlight regions where education levels and weekly incomes are lower.
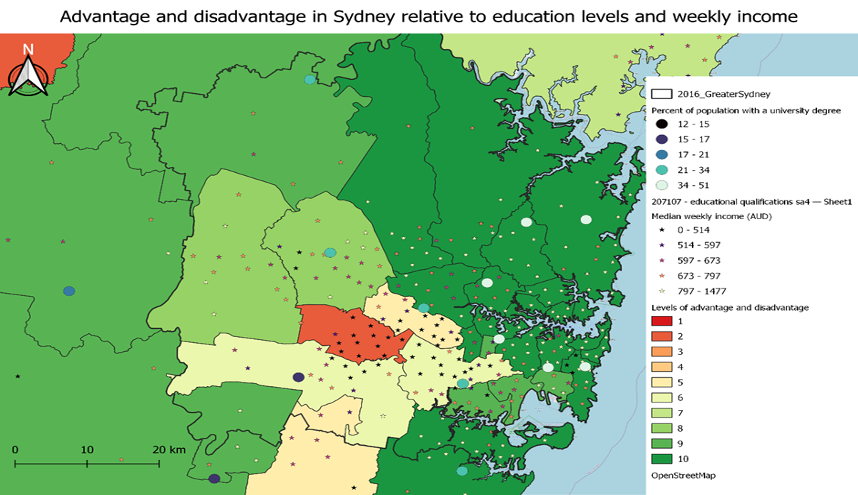
The strong relationship between socioeconomic circumstances, income, and education is shown in this map. It emphasizes how places with lower levels of education frequently have lower weekly earnings as well, which raises the likelihood of disadvantage (Baum, O’Connor, & Stimson, 2005). Low socioeconomic areas may have restricted access to public transportation, which makes it challenging for locals to find work and obtain basic services. Furthermore, affordable housing is a greater problem in low-income communities.
Map 4: Car Ownership, Distance Traveled to Work, and Train Station Access in Disadvantaged Suburbs of Sydney
Map 4 offers a thorough overview of car ownership, commute time to work, and train station accessibility in Sydney’s underprivileged areas. The map makes use of gradients of color in addition to symbols. Darker triangle symbols are used to indicate areas with a larger percentage of automobile ownership, while darker colors are used to represent areas with restricted access to train stations. The map clearly shows how dependent impoverished suburbs are on car ownership. Larger symbols indicate greater ownership of cars. Deeper hues are also used to indicate locations with restricted access to train stations.
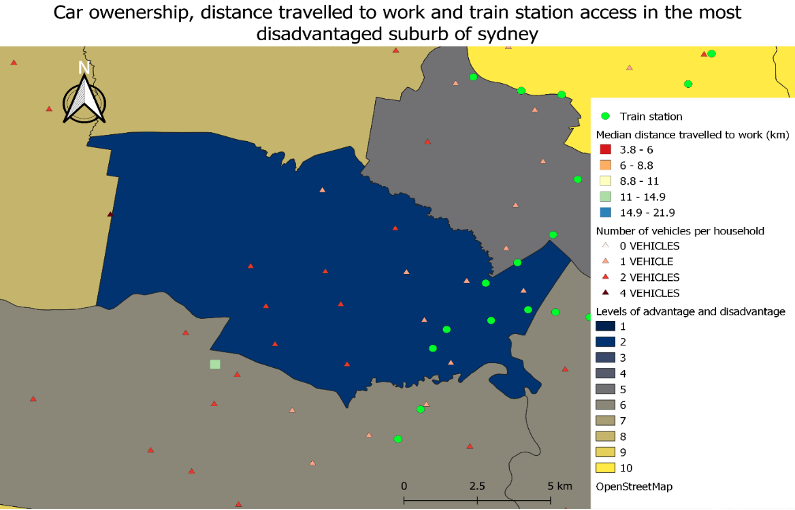
The relationship between work, transportation, and spatial disadvantage is shown on this map. Due to poor public transportation, residents of underprivileged suburbs frequently turn to auto ownership, which raises transportation expenses and puts a strain on finances. Due to restricted access to jobs and services, underprivileged suburbs may experience transportation disadvantages due to a lack of public transit choices. This exacerbates the disadvantage for residents by adding to their financial load and the problem of excessive housing prices (Dodson & Sipe, 2008).
Map 5: Car Ownership, Distance Traveled to Work, and Train Station Access in Advantaged Suburbs of Sydney
Map 5 sheds light on transportation dynamics in Sydney’s privileged areas. The car ownership, commute time to work, and accessibility to train stations are all displayed on the map. It uses color gradients and symbols, with brighter hues denoting better access to train stations and darker triangular symbols signifying higher car ownership. The map shows that the prevalence of car ownership is lower in affluent suburbs. Triangles on the map with lighter colors indicate fewer automobile owners and a lesser emphasis on personal transportation.
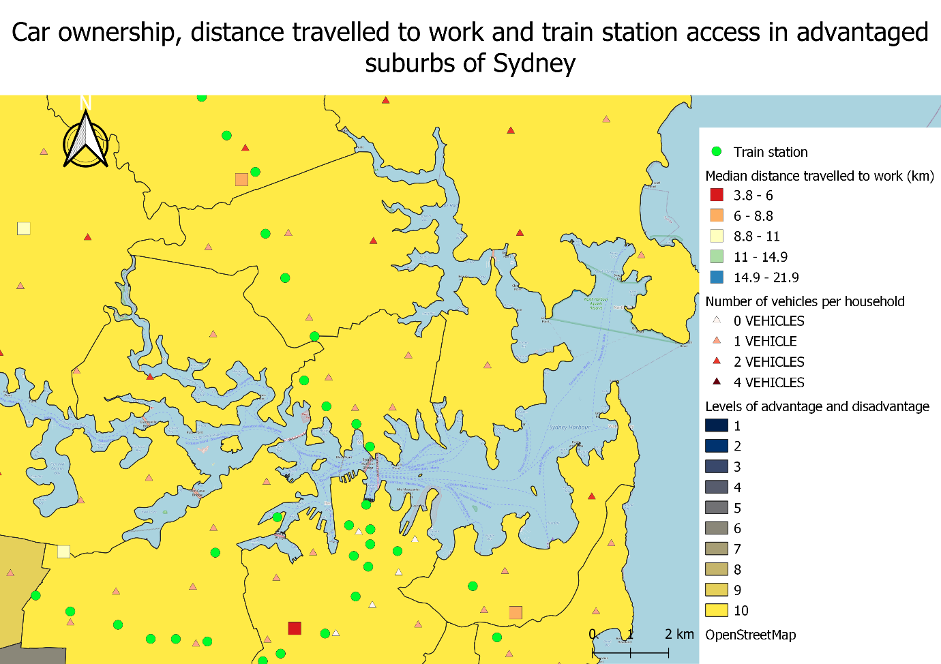
This map illustrates the significance of public transit in affluent areas. There are more rail stations nearby, suggesting that locals have access to more practical and environmentally friendly forms of transportation. Transit disadvantage problems can be lessened in privileged suburbs with effective public transit (Dodson & Sipe, 2008). High housing costs are still a problem, affecting newcomers and locals.
Conclusion
This GIS analysis has shown several advantages and disadvantages in deciphering Sydney’s complex network of spatial inequities. The study’s maps clearly show how the city’s socioeconomic circumstances and economic prospects are distributed in different ways. Disparities in employment, immigration, education, income, and transportation patterns among different geographic areas represent larger conversations about benefits and drawbacks in Australian cities. The intricate relationship between these variables highlights how interwoven socioeconomic circumstances and accessibility to transportation are. Restricted public transportation alternatives make living in impoverished suburbs more difficult for inhabitants, driving them to purchase cars and increasing their financial burden. On the other hand, affluent suburbs benefit from improved public transportation systems, which lower automobile ownership rates and increase mobility. The maps have revealed that housing affordability is still a major issue that affects the socioeconomic landscape in both disadvantaged and advantaged communities. Comprehensive measures that improve public transportation, support fair housing possibilities, and guarantee that everyone may benefit economically will be necessary to address these gaps. Policymakers, urban planners, and researchers can use these maps as useful tools in their joint efforts to create a more equitable and inclusive Sydney.
References
Baum, S., O’Connor, K., and Stimson, R., 2005. Fault lines exposed: advantage and disadvantage across Australia’s settlement system. Melbourne: Monash University Press
Burke, T. and Hulse, K., 2015. Spatial disadvantage: why is Australia different? Melbourne: Australian Housing and Urban Research Institute, AHURI Final Report
Burke, T. and Stone, J. and Glackin, S. and Scheurer, J. 2014. Transport disadvantage and low-income rental housing. AHURI Positioning paper. 157: pp. 1-62
Currie, G. and Delbosc, A. 2011. Transport Disadvantage: A Review, Currie, G. (Ed.) New Perspectives and Methods in Transport and Social Exclusion Research, Emerald Group Publishing Limited, pp. 15-25
Dodson, J. and Sipe, N., 2008. Shocking the suburbs: urban location, homeownership and oil vulnerability in the Australian city. Housing Studies, 23(3), pp.377-401.
 write
write