Abstract
Walmart Inc. is a multinational retail corporation based in America that engages in operating a chain of hypermarkets, grocery stores, and discount department stores. The company’s financial performance and position has fluctuated across the period. However, the company is driven to use price as a selling point in its business strategies to attract and retain target customers across the globe and is committed to helping the customers save more money and live better. The company’s total revenues increased across the period, which means a rise in its productivity and operating efficiency. Despite the fluctuation in net income, Walmart is profitable in its operations as it is generating enough returns for the shareholders. Walmart is relatively productive and proficient in its operations and hence is creating value for the shareholders. However, the company has poor short-term liquidity as it cannot meet its short-term obligations using current assets. The total assets fluctuated across the period but shows a general upward trend meaning the company acquired more assets thereby improving its financial position.
Brief Overview
Walmart Inc. is a multinational retail corporation based in America that engages in operating a chain of hypermarkets, grocery stores, and discount department stores (Walmart, Inc., 2021). Its operations are carried out from the United States and is headquartered in Bentonville, Arkansas. The company was established in 1962 and has grown ever since and as of 31st January 2022, the company has 10,593 stores and clubs in 24 countries across the globe (Walmart, Inc., 2021). The businesses or stores and clubs operate under 48 different names. Moreover, Walmart is the largest company in the world by revenue in addition to being the largest private employer globally with 2.2 million employees.
The vision statement of Walmart is “Be the destination for customers to save money, no matter how they want to shop” (Walmart, Inc., 2021). As a result, the statement clearly echoes the principal reasons behind its desire to position itself as the retail leader. Moreover, its mission statement is “to save people money so they can live better,” which reflects the idea of its founder, Sam Walton (Walmart, Inc., 2021). As a result, the company’s slogan is “Save Money. Live Better.” Therefore, the company uses price as a selling point in its business strategies to attract and retain target customers across the globe.
According to its corporate social responsivity statement, Walmart aim at building a better world by helping people live better in addition to renewing the planet while building resilient and thriving communities (Walmart, Inc., 2021). Therefore, the company is committed to working to build a more sustainable future, create opportunity, bring communities closer together, and advance inclusion, equity, and diversity. Therefore, the company helps the customers save more money at the end of the day for the things they care about most. The paper shows a trend analysis on the financial performance of Walmart, Inc. over five years. Trend analysis, also referred to horizontal analysis, is utilized to spot financial trends over a given period. The pictures of financial statements used in the trend analysis are provided in Appendix 7 (income statements) and 8 (balance sheets)
Horizontal Analysis
Horizontal analysis shows the trends and growth patterns in the financial statements of business entities (Robinson, 2020). Therefore, it helps to determine the company’s performance over time.
Revenues and Income
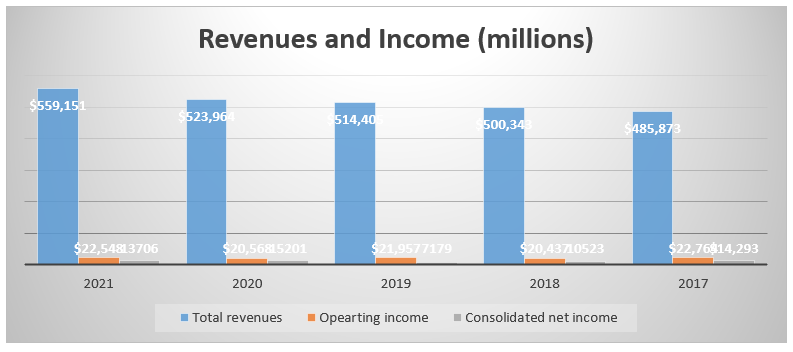
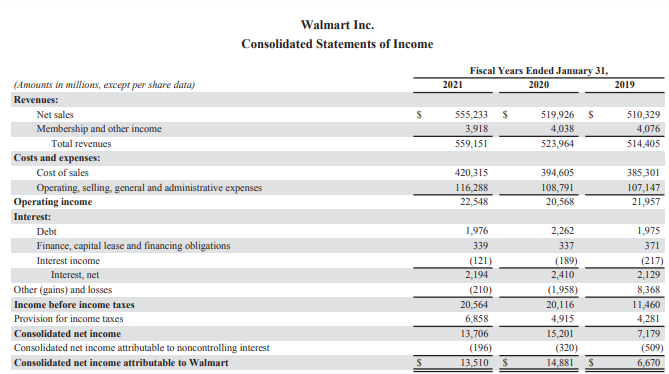
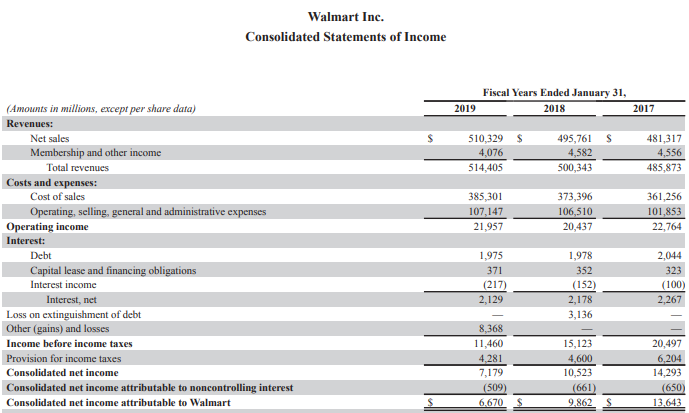
According to Appendix 1, the company’s total revenues shows a general upward trend across the period; it increased from $485,873 million in 2017 to $559,151 million in 2021 (Appendix 7). As a result, the company’s productivity shows a general consistent upward trend. However, the operating income fluctuated across the period but declined from $22,764 million in 2017 to $22,548 in 2021. Additionally, the net income shows a fluctuating trend but reduced from $14,293 million in 2017 to $13,706 million in 2021.
Income Statement
Appendix 2 depicts the horizontal analysis of the statement of income of Walmart, which shows that the total revenues increased consistently across the period. Compared to 2017, it increased by 3% in 2018, 5.9% in 2020, and 15.1% in 2021. Despite the pandemic, the company’s revenues rose continuously as it offers essential services. The more significant component of the yearly income statement items for Walmart was net sales that account for a greater portion of its total revenues than the membership and other income across the period. However, the membership and other revenues for 2018 increased by 0.6% but declined by 10.5% in 2029, 11.4% in 2020 and 14% in 2021. The membership and other income decreased in 2020 due to the social distancing measures that limited movement of people.
On the other hand, the company’s cost and expenses increased steadily across the period. For instance, the cost of sales increased by 3.4% in 2018, 6.7% in 2019, 9.2% in 2020, and 16.3% in 2021. The relative increase in cost of sales were higher than that of net sales meaning the company’s operating efficiency decreased across the period (Petersen, Plenborg & Kinserdal, 2017). Additionally, the operating, selling, general and administrative expenses also increased thereby adversely impacting the operating income. For instance, the operating income fluctuated across the period but it shows a downward trend compared to the values in 2017. As a result, the operating efficiency and profitability of Walmart decreased between 2017 and 2021 despite the steady rise in total revenues across the period.
The company also incurs significant expenses in terms of interest costs, which also decreased across the period. The downward trend in net interest implies that Walmart is taking fewer loans to finance its operations (Lessambo, 2018). Therefore, it is decreasing its financial leverage. However, the provision for income taxes significantly increased by 10.5% in 2021 which decreased its consolidated net income, showing a decrease in profitability, productivity and operating efficiency. Subsequently, although the expenses incurred by the organization rose across the period, the overall relative rise in sales was higher. Therefore, the business is relatively productive and proficient in its operations and is likely to have the same trend in future. Therefore, it will keep creating sufficient net income for a significant length of time.
Assets
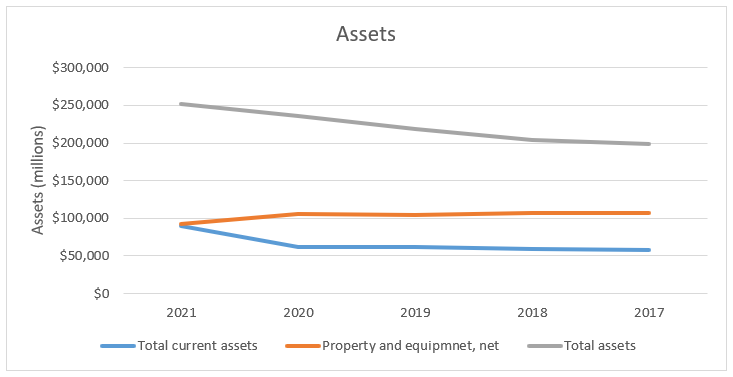
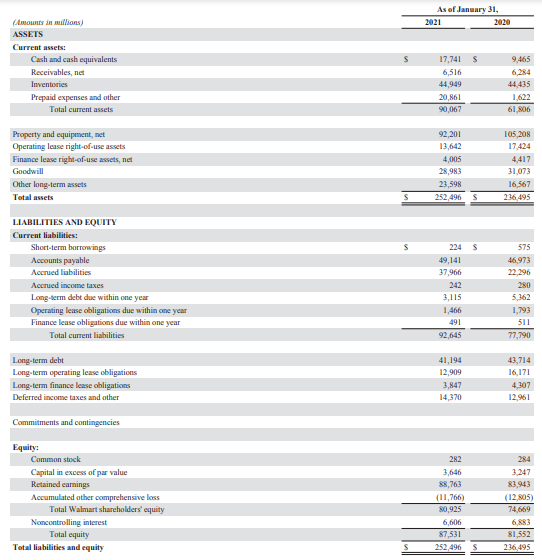
According to Appendix 3, the company’s total assets increased across the period. This implies a rise in its financial position and the capacity to generate revenues (Lessambo, 2018). However, the total current assets and net property and equipment remained relatively stable across the period. Therefore, the company slightly decreased its investment in long-term assets to be used in generating revenues. The total current assets shows a steady rise across the period. As a result, the capacity of the company to pay its short-term financial obligations increased.
Current Assets and Liabilities
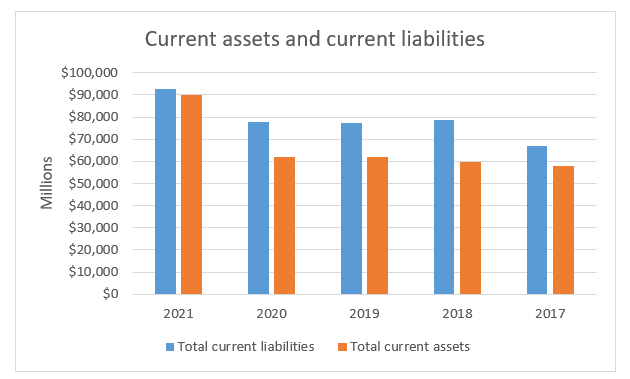
Appendix 4 shows that the total current assets are lower than the total current liabilities. Therefore, Walmart is not liquid and has poor financial position as it cannot use its current assets in meeting all of its short-term financial obligations. The company has poor short-term liquidity.
Equity and Liabilities
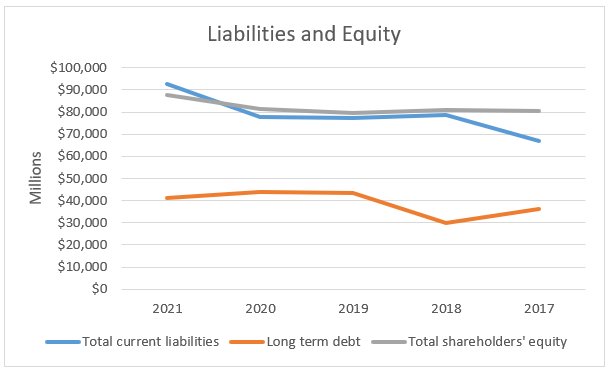
As per Appendix 5, the liabilities and shareholders’ equity fluctuated across the period. The long-term debt decreased in 2018, rose in 2019 and then decreased steadily across the remainder of the period. The downward trend in long-term debt implies reduction in financial risks faced by the company. However, the total shareholders’ equity is higher than the long-term debt meaning the company uses fewer debts in its operations (Lessambo, 2018). Therefore, it is lowly leveraged. The total current liabilities increased across the period meaning a rise in short-term financial obligations, which negatively affects the company’s liquidity.
Balance Sheet
Consequently, the vast majority of the balance sheet items for Walmart expanded across the period. Concerning current assets, the cash and cash equivalents increased the most. Therefore, the total current assets increased steadily across the period meaning a rise in its ability to meet its near-term financial obligations (Kioko & Marlowe, 2017). However, the net property and equipment decreased across the period meaning the company disposed of some of its property and equipment. Besides, of the long-term assets, capital lease and financing obligations increased the most meaning the company increased its usage of other people’s assets for a fee. The total assets fluctuated across the period but shows a general upward trend meaning the company acquired more assets thereby improving its financial position (Lessambo, 2018). The total current liabilities increased across the period meaning a rise in short-term financial obligations, which negatively affects the company’s liquidity. For instance, the total current liabilities rose by 17.35 in 2018 and 38.4% in 2021. The long-term debts decreased by 16.7% in 2018, increased by 21.4% in 2020 and by 14.4% in 2021 (Appendix 6), which shows a slight decline compared to the previous year. The downward trend in long-term debt implies reduction in financial risks faced by the company. The descending pattern in total liabilities shows that Walmart has embraced fewer obligations to meet its operating expenses because of the negative monetary effect of the COVID-19 pandemic.
Conclusion
In summation, Walmart is a good investment opportunity because it has remained profitable across the period despite the fluctuation in its net income. The total assets increased across the period meaning the company acquired more assets thereby improving its financial position. The long-term debt has decreased implying a reduction in financial risks faced by the company. Moreover, its productivity has increased across the period. Therefore, the company has made a significant step toward realizing its mission of helping people save money so they can live better by charging everyday low prices.
References
Kioko, S., & Marlowe, J. (2017). Financial strategy for public managers. Seattle, WA: Rebus Community.
Lessambo, F. I. (2018). Financial statements: Analysis and reporting. Cham, Switzerland: Palgrave Macmillan.
Petersen, C. V., Plenborg, T., & Kinserdal, F. (2017). Financial statement analysis: Valuation: Credit analysis: Performance evaluation. Bergen: Fagbokforlaget.
Robinson, T. R. (2020). International Financial Statement Analysis Workbook. Newark, United States: Wiley.
Walmart, Inc. (2021). 2021 annual report for Walmart Inc. https://s2.q4cdn.com/056532643/files/doc_financials/2021/ar/WMT_2021_AnnualReport.pdf
Appendices
Appendix 1: Revenue and income
Appendix 2: Horizontal analysis
| WALMART INC. | |||||
| Consolidated Statements Of Income | |||||
| 2021 | 2020 | 2019 | 2018 | 2017 | |
| Revenues | |||||
| Net sales | 115.4% | 108.0% | 106.0% | 103.0% | 100.0% |
| Membership and other income | 86.0% | 88.6% | 89.5% | 100.6% | 100.0% |
| Total revenues | 115.1% | 107.8% | 105.9% | 103.0% | 100.0% |
| Costs and expenses | |||||
| Cost of sales | 116.3% | 109.2% | 106.7% | 103.4% | 100.0% |
| Operating, selling, general, and administrative | 114.2% | 106.8% | 105.2% | 104.6% | 100.0% |
| Operating income | 99.1% | 90.4% | 96.5% | 89.8% | 100.0% |
| Interest | |||||
| Debt | 96.7% | 110.7% | 96.6% | 96.8% | 100.0% |
| Finance, capital lease and financing obligations | 105.0% | 104.3% | 114.9% | 109.0% | 100.0% |
| Interest income | 121.0% | 189.0% | 217.0% | 152.0% | 100.0% |
| Interest, net | 96.8% | 106.3% | 93.9% | 96.1% | 100.0% |
| Other (gains) and losses | -16.9% | -157.3% | 672.1% | 251.9% | 100.0% |
| Income before income taxes | 100.3% | 98.1% | 55.9% | 73.8% | 100.0% |
| Provision for income taxes | 110.5% | 79.2% | 69.0% | 74.1% | 100.0% |
| Consolidated net income | 95.9% | 106.4% | 50.2% | 73.6% | 100.0% |
| Noncontrolling interest | 30.2% | 49.2% | 78.3% | 101.7% | 100.0% |
| Consolidated net income attributable to Walmart | 99.0% | 109.1% | 48.9% | 72.3% | 100.0% |
Appendix 3: Assets
Appendix 4: Current assets and liabilities
Appendix 5: Equity and liabilities
Appendix 6: Horizontal analysis of Balance Sheet
| MAGNA INTERNATIONAL INC. | |||||
| CONSOLIDATED BALANCE SHEETS | |||||
| 2021 | 2020 | 2019 | 2018 | 2017 | |
| ASSETS | |||||
| Current assets | |||||
| Cash and cash equivalents | 258.0% | 137.8% | 112.5% | 98.4% | 100.0% |
| Receivables, net | 111.7% | 107.7% | 107.7% | 96.2% | 100.0% |
| Inventories | 104.4% | 103.2% | 102.8% | 101.7% | 100.0% |
| Prepaid expenses and other | 1074.8% | 83.6% | 186.7% | 180.9% | 100.0% |
| Total current assets | 156.1% | 107.1% | 107.3% | 103.4% | 100.0% |
| Property and equipment, net | 85.6% | 97.7% | 96.8% | 100.0% | 100.0% |
| Capital lease and financing obligations | 272.8% | 337.7% | 109.4% | 110.4% | 100.0% |
| Goodwill | 170.1% | 182.4% | 183.0% | 107.1% | 100.0% |
| Other long-term assets | 237.9% | 167.0% | 149.4% | 118.9% | 100.0% |
| Total assets | 127.0% | 118.9% | 110.3% | 102.9% | 100.0% |
| LIABILITIES AND SHAREHOLDERS’ EQUITY | |||||
| Current liabilities | |||||
| Short-term borrowings | 20.4% | 52.3% | 475.4% | 478.3% | 100.0% |
| Accounts payable | 118.6% | 113.4% | 113.6% | 111.2% | 100.0% |
| Accrued liabilities | 183.8% | 108.0% | 107.3% | 107.1% | 100.0% |
| Accrued income taxes | 26.3% | 30.4% | 46.5% | 70.0% | 100.0% |
| Long-term debt due within one year | 138.1% | 237.7% | 83.2% | 165.7% | 100.0% |
| Capital lease and financing obligations due within one year | 346.4% | 407.8% | 129.0% | 118.1% | 100.0% |
| Total current liabilities | 138.4% | 116.2% | 115.8% | 117.3% | 100.0% |
| Long term debt | 114.4% | 121.4% | 120.8% | 83.4% | 100.0% |
| Long-term capital lease and financing obligations | 279.1% | 341.1% | 111.3% | 112.9% | 100.0% |
| Deferred income taxes and other | 153.8% | 138.7% | 128.2% | 89.4% | 100.0% |
| Total shareholders’ equity | 108.7% | 101.3% | 98.9% | 100.4% | 100.0% |
| Total liabilities and shareholder’s equity | 127.0% | 118.9% | 110.3% | 102.9% | 100.0% |
Appendix 7: Income statements
Appendix 8: Balance sheets
 write
write