Prepare a brief description of Tesla inc. Amazon.com, the report should include; main areas of business activities, main products, and principles geographies 160 words.
Cars and electricity, and housing alternatives are only some of the products Teslas, Inc. manufactures, manufactures, makes, sells, leases, and offers integrated activities. Automobiles and energy generation and storage both fall under this category. The automotive sector encompasses a wide range of activities, including vehicle conception and development, manufacturing, distribution, sale, and electric vehicle leasing and regulatory credits. Energy producing and storing industries include all aspects of solar energy research, manufacture, assembling, sales, and leases, along with resources devoted to its products and firms of solar energy incentives (Almenhali et al., 2021). Automotive and Power Generating are the two key segments of the company’s corporate structure. These subdivisions are insignificant compared to the organization’s mechanism structure (Mottaghi & Farhangdoost, 2021).
Amazon.com is likely the corporation most closely associated with the E-Commerce phenomenon in many respects. This case aims to offer a comprehensive and up-to-date business record of Amazon. To satisfy the mass, Amazon has adjusted its mission and vision. Those principles—keeping a long-term commitment, stressing about clients and their requirements, and aggressively innovating to satisfy those needs—have stayed constant for more than twenty years and are at the core of Amazon’s “Day 1” philosophy. Day 1 is a culture and an operational strategy at Amazon that focuses on customers first in all they do. We attempt to understand our consumers profoundly and step back from their pain spots to provide innovative solutions quickly.
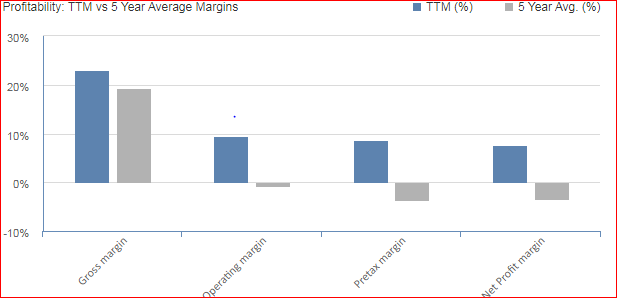
Using the financial ratios bar chart included in the report, comment on the performances of both Amazon and Tesla companies over the past five years using your findings, outlining changes in the company’s fortunes and change drivers.
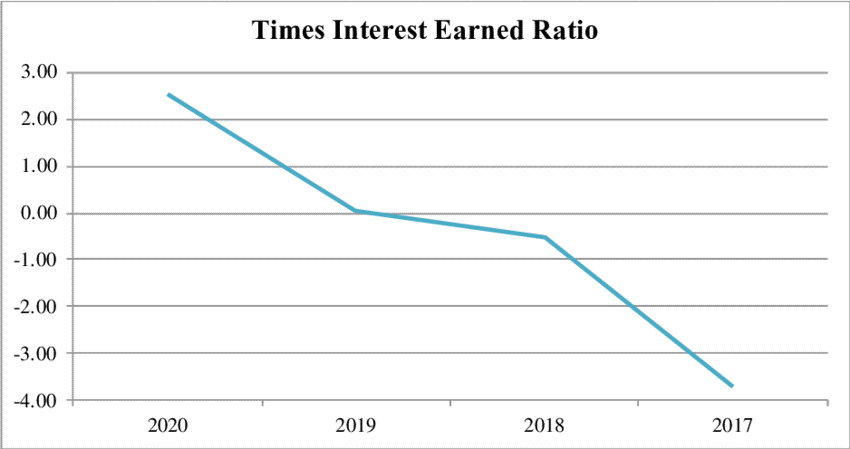
These ratios indicate an organization’s ultimate stability and the degree to which it relies on lengthy debt to fund its operations. Bankers utilize debt-to-equity and deficit ratios to determine how company assets are invested, whether via lenders or your purchases. A balanced scorecard of each cash flow budget is one of the most successful methods to compare two firms. To arrive at a link amongst different statistics in the financial accounts, such as operating profit or total costs, a ratio analysis examines them. Based on Tesla Inc’s most current earnings reports, this table provides significant financial statistics such as Value (P/E Ratio), Operating profits (EPS), Surrender (ROI), and others.
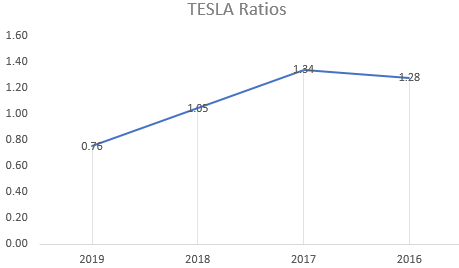
TESLA Financial Ratios
Stock in Tesla Inc. is quite popular right now. Amazon company’s illustrious founders are well-known around the globe. Under Elon Musk’s management, Tesla Inc. has launched several new and disrupt its industry. As a consequence of these conditions, the company has risen to the top in its field. These data may be sufficient for some investors to purchase shares in the firm. The accounting information and financial ratios of a business are vital for companies to know before investing. Good investment choices might well be made when investors get a complete picture of Tesla’s financial health.
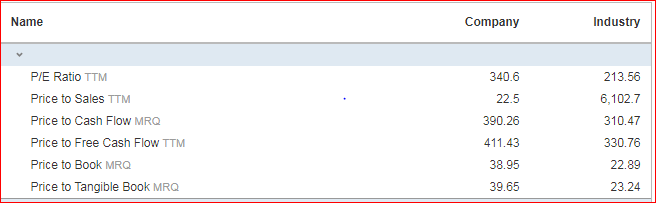
| Name | Company | Industry | ||||||||||||||||||
|
||||||||||||||||||||
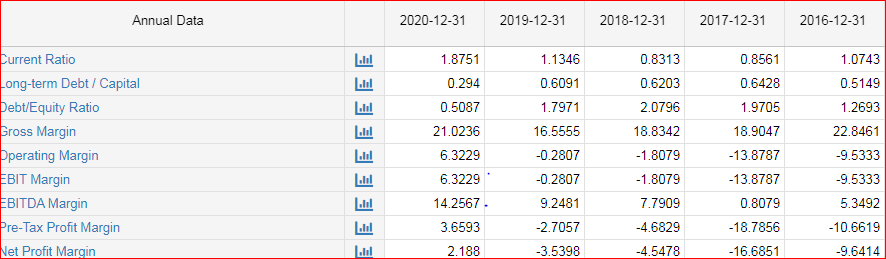
This research was based on an economical external analysis Case, Inc. in better understand from 2017 until 2020. Ultimately, we want to fully grasp profitability ratios to compare the group’s time-generated balances to similar businesses.
This research relied on an economical external analysis Case, Inc. to understand Tesla’s company monetary state from 2017 to 2020. The main objective of the study is to get a detailed considerate of a balanced scorecard so that the financial reputation within the market can be assessed.
Data was acquired via Marketwatch, the data was used to create five different ratios, comprising revenue, solvency, engagement, funds, and the debt ratio. Overall, this study is supported mainly by basic recommendations that might benefit the company’s stakeholders.
Amazon Financial Ratios
In the third quarter, Amazon’s shares rose from 41.0 percent to 42.10 percent; according to estimates, the total online revenue in that nation topped $212.40 billion, National Small business 360. North American revenues rose 10.3% in the fourth period of 2020, excluding income from the Amazon Web Solutions (AWS) cloud technology segment but including marketing and seller rewards and fees, during which the epidemic was burning, and internet purchases were at an all-time high. In the third period of this year, resellers accounted for 56 percent of all unit sales on Amazon’s global sites, up over 54 percent a year before.
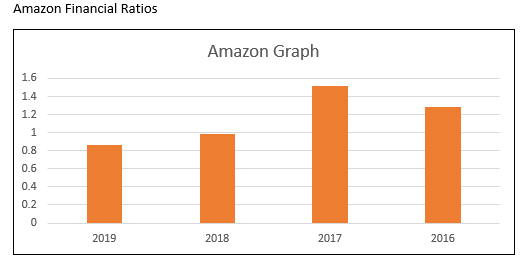
Amazon makes money by selling physical goods and digital services to customers. A considerable portion of Amazon’s revenue comes from retail sales, with retail and electronic stores nearly two-thirds of those sales. The firm thinks that gaining market share would take the economy of scale and reduce costs. Amazon can exert price influence on customers if it has a higher market share. Critics argue that the corporation should start displaying greater earnings and dividend payments sooner rather than later.
Using the return volatility space, density plots, and summary statistics, write a full comment on the risks policies of Tesla and Amazon com and the market index.
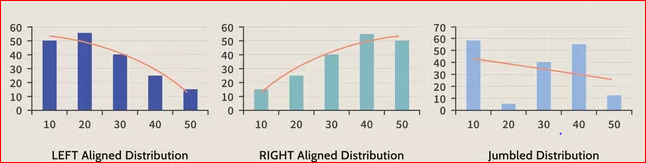
On both Amazon and Tesla, the normality test presents all of its results symmetric, with most of the results clustered around the probability’s mean. The weighting of every asset is multiplied by its anticipated return, and the figures for every investment are added to compute the stock portfolio’s expected value. For instance, a portfolio with three assets has a 35 percent weighting in property A, a 25% in asset B, and a 40% in asset C. Each one of these graphs has a red trendline. This is an approximate set of data spread trends. The first, the “LEFT Oriented Range,” shows that the bulk of the data sets is in the lower range. The majority of information points in the final “RIGHT Aligned Probability” graph fall towards the upper end of that spectrum. At the same time, the third, “Jumbled Distribution,” depicts a diverse set of statistics with no apparent trend. Many examples exist when statistics tend to cluster around the arithmetic mean. That diagram shows a perfect normality test distributed on both edges, with the most significant number of points centered in the middle. A correlation value of 1 denotes a high positive correlation seen between the price of two, implying that they always move by the exact amounts. A rating of -1 shows a complete inverse relation, which means the equities have always gone in the reverse direction historically.
The rapid spread of the Omicron variety did not stop US equities from surging in November. For the quarter, the S&P 500 increased 4.5 percent, with cycle value companies outpacing growth. The “reopening trade” saw active funds lead the way during the first 4 years of the year inverted in playmaker, with equities taking the lead through November. The return on an u.s. Treasury bond ticked up in January but closed the year at 1.52 percent, which is still unusually low. In 2021, U.S. equities were the location to be, with a performance of +27 percent, which was 19 percent greater than an MSCI index that tracked 49 advanced and emerging nations.
The distributions tapers off consistently to towards the fringes values between 0 and 100, with the center value of 50 (has the most datasets) being the most common. The bell curve is asymmetrical from around the middle point, with half of the frequencies on every side.
The fourth quarter of 2021 is predicted to have robust economic growth in the United States. The Amazon Federal Treasury’s GDP Now algorithm anticipates real Gdp in the third period at 7.4% as of February 4, but Stock Market seems to are closer to 6%. The effect of the Omicron variety is more expected to be in supply shortages associated with individuals missing work owing to illness, rather than lower sales in leisure, catering, and travel (as in earlier generations). The same basic economic conclusion holds today as it did throughout prior rounds of the disease outbreak:
Identify variances of the MVP in your report and explain the frontier and MVP represents
Explain the types of risks and discuss the limits of diversification
Without performances of the improved portfolios is described in this research, which applies minimal variance portfolio optimizing to the Baltic equities markets. Portfolio values are adjusted using a sample covariance matrix augmented by a Bayesian shrinking process. When compared to capital-balanced market indexes, empirical studies reveal that Baltic minimal variation portfolios exhibit 20-30% reduced volatility in the lengthy period without sacrificing profits. During marketplace upturns, such portfolios lag the create a market in terms of returns, but they dramatically exceed during market downturns. The findings show that using most minor fractional part optimization to enhance Baltic equities’ investing performance might be significant.
Since the 2007-time highs, capital-based Baltic sharemarket indexes have lost nearly 70% of the value by the end of 2009. Furthermore, this considerable drop was accompanied by previously unseen volatility, which was many times greater in the last months of 2008 than in previous years. Investors’ appetite for risk has been considerably reduced due to the market instability, forcing market players to seek out defensive methods that are less exposed to market volatility. Most minor squares profile (MVP) optimizer, built on Markowitz’s (1952, 1959) Nobel Prize-winning Modern Portfolio Theory, is one of the investing methods to lower portfolio risk. The technique sets portfolio weights so that assets are diversified as efficiently as possible while the portfolio’s volatility is kept to a minimum. MVPs showed returns equivalent to their baseline capitalization-weighted indexes but with a 25-30% smaller standard deviation, according to Haugen and Baker (2021), Clarke, Silva, and Thorley. As a result, it’s no wonder that the minimal variance equity approach has grown in popularity, with a slew of institutional investors and tradable indexes having been created since 2007. Academic study and practical implementations of the potential MVP ability, on the other hand, have been limited to the world’s significant financial markets. It’s debatable if it’s feasible to lower investment risk by at least 25% without sacrificing profits in small developing economies like the Baltics. In 2001-2008, empirical data reveal that an investing strategy based on MVP optimization beat Baltic size and financial market indexes (Lim & Tan, 2021). The benefits of MVPs were undeniable during the recent time of a turbulent market collapse. The rest of the paper is laid out as follows. Section 2 covers a theoretical basis as well as actual MVP investigations. Section 3 discusses the data and techniques utilized in the analysis. Section 4 contains empirical results, which are then discussed in Section 5. Section 6 wraps up and summarizes the ramifications.
Portfolio Management Theory (MPT), developed by Harry Markowitz in the 1950s, is used to optimize least-squares portfolios. The idea has weathered the staying power and is now one of essential principles in selecting earnings power (Liu, 2021). Its importance has been generally acknowledged by academics and practitioners alike. This section provides a quick overview of MPT’s conceptual perspective, which should be adequate for a reader to comprehend the paper’s fundamental principles. Haugen’s (2001) and Elton and Gruber’s (2006) publications may well be a more thorough description, which I cite as sources in the next section.
References
Almenhali, A., Alhajeri, H., Almansoori, H., Aljneibi, N., Almansoori, N., Alsulaity, N., … & Nobanee, H. (2021). Financial Analysis of Tesla. Available at SSRN 3896901.
Lim, Y. X., & Tan, C. (2021). Do adverse events have deteriorating effects on stock performance? A comparative study on Tesla (US) and Nio (China). Journal of Asian Business and Economic Studies.
Mottaghi, N., & Farhangdoost, S. (2021). Stock Price Forecasting in the presence of Covid-19 Pandemic and Evaluating Performances of Machine Learning Models for Time-Series Forecasting. arXiv preprint arXiv:2105.02785.
Liu, S. (2021, March). Competition and Valuation: A Case Study of Tesla Motors. IOP Conference Series: Earth and Environmental Science (Vol. 692, No. 2, p. 022103). IOP Publishing.
 write
write