Purpose
The report aims to analyze deviations in a pharmaceutical company since 2023 while following the ‘Deviations and Investigation’ requirements. The investigations are across thirteen departments within manufacturing.
Scope
The review is composed of all deviations raised between 1/4/2023 to 1/182024. In the report, the trends included are recurring deviations, root causes, deviations exceeding timeframes, and the total of open overdue records.
Background
In a pharmaceutical company, deviations are usually managed by Quality Management Systems. The system monitors performance by evaluating functionalities and ensuring continuous improvements on deviations. The report is composed of 252 deviations raised in different departments deviations since 2023. All deviations are categorized depending on the department.
Summary of Finding
Root Causes
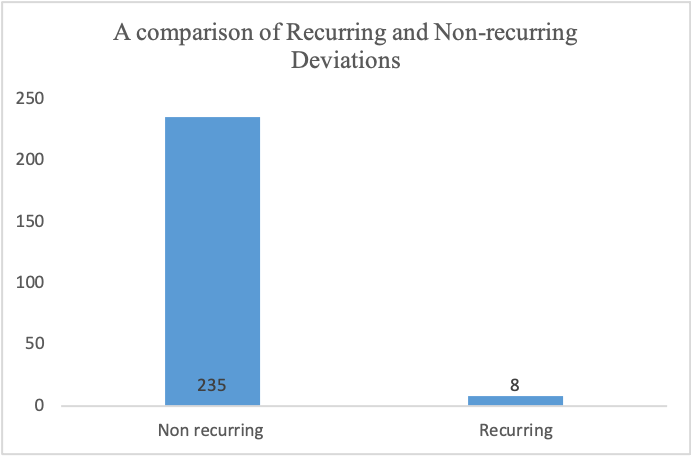
A comparison of the Total Recurring and Non-recurring Deviation
The Total Number of Deviations Raised Per Department
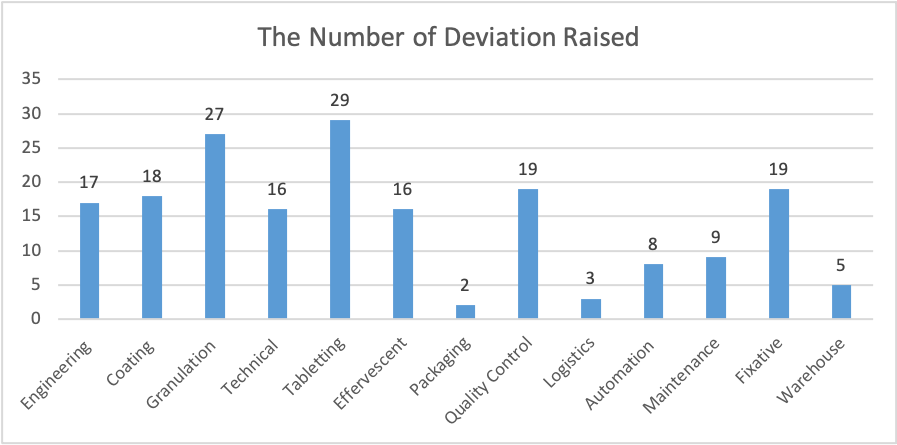
Figure 2
Recurring Deviations on Departments
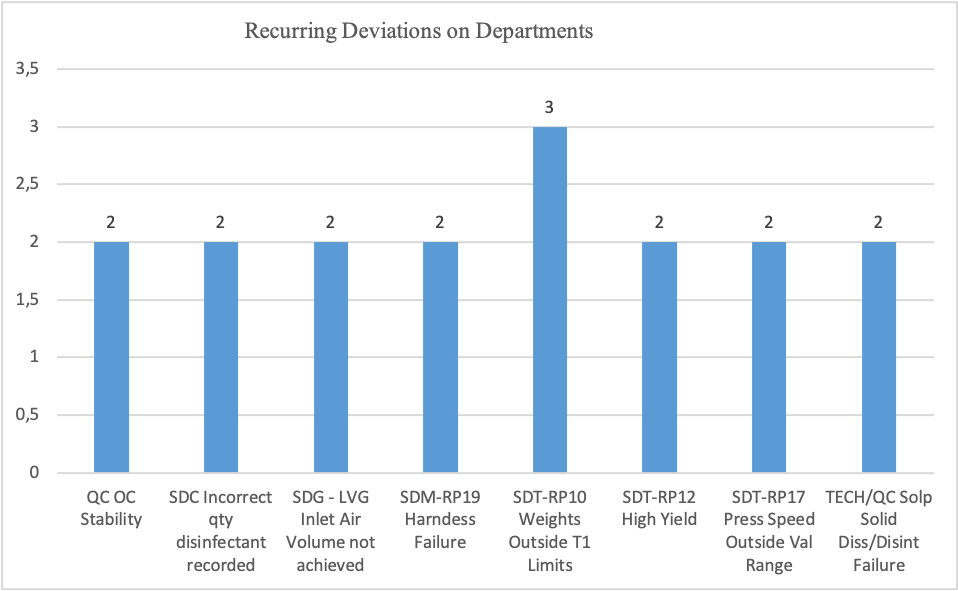
Figure 3
Evaluation
Since 2023, a total of 252 deviations have been raised to the pharmaceutical company. From Figure 1, the total recurring deviation was 3.174%, which was about eight quality issues. From Figure 1, it’s evident that about eight deviations had more than one cause, while 235 had one root cause. In Figure 2, From the 252 issues raised since 2023, about 180 issues were from the thirteen departments: Engineering, Coating, Granulation, Technical, Tableting, Effervescent, Packing, Quality Control, Logistics, Automation, Maintenance, Fixative, and Warehouse. The Department of Tabletting received the highest number of notifications on quality issues, 29, followed by the Granulation Department, with 27. The packaging department had the least notifications on quality deviations. Figure 3 illustrates the frequency of recurring deviations in different departments. From the graph, it’s evident that RP10 weights outside T1 limits are a frequent deviation in the Tabletting (SDT) department. Also, from Figure 3, it’s clear that several recurring deviations occur in the Tabletting department, followed by quality control.
Frequency of Deviations Raised by the Materials
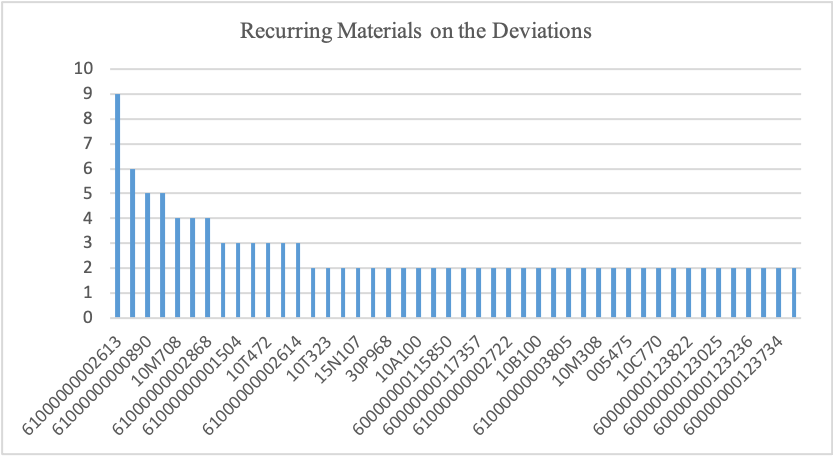
Figure 4
Deviations Contributed by Material 61000000002613 on Different Departments
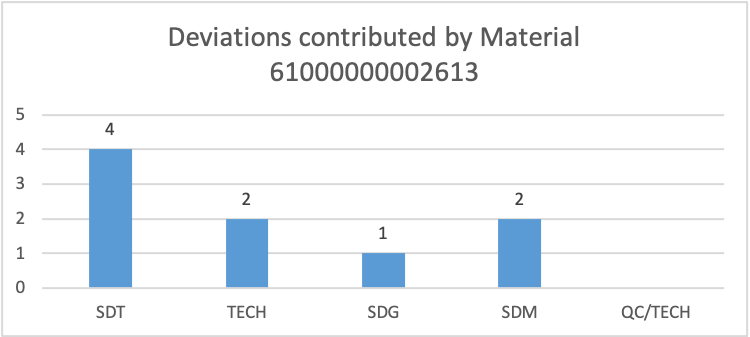
Figure 5
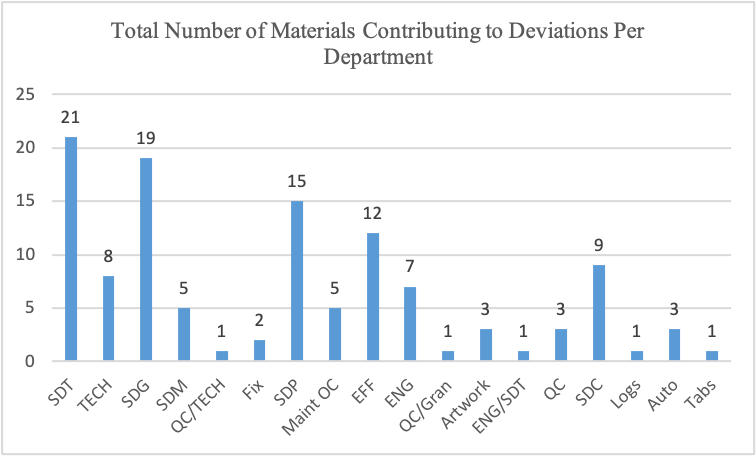
From the 252 deviations raised in the pharmaceutical company, about 39 notifications on deviations should have included the material used. Recurring deviations from similar materials were 46, while notifications from non-recurring deviations on different materials were 92. Figure 4 illustrates frequent deviations raised by similar material across the departments. From the graph, it’s evident that materials 61000000002613 contributed to the highest deviations with a total of nine, followed by 10T125 with a total of six deviations. Figure 5 illustrates how material 61000000002613 affected the four departments. The graph indicates that material caused several deviations in the SDT department, followed by the TECH and SDM departments. Additionally, table 2 illustrates that deviations contributed by material 10T125 only affected the SDT department.
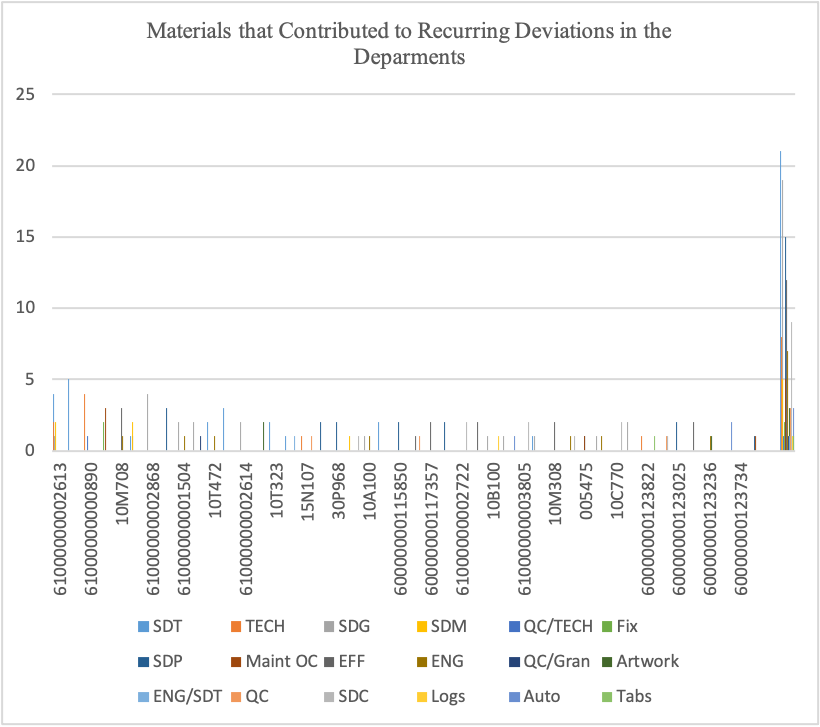
Figure 6
Figures 6 and 7 illustrate how different materials influenced deviations in the departments. From Figure 7, it’s evident that materials followed by SDG contributed materials contributed to in SDT department.
Deviations Including Batch
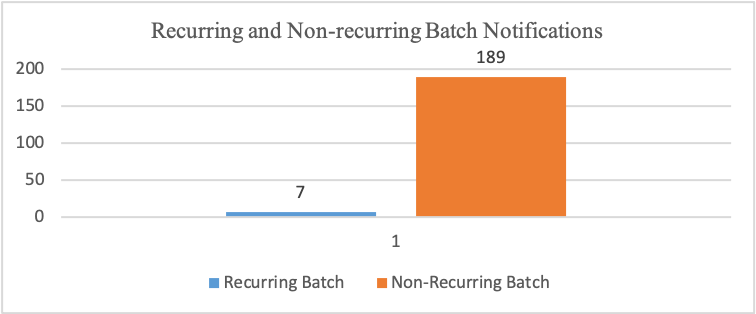
From the 252 notifications received at the pharmaceutical company, about 49 notifications still need to include batch identifications. About seven notifications had similar batch figures, while 189 had different batch identification figures.
Number of Open and Closed Records
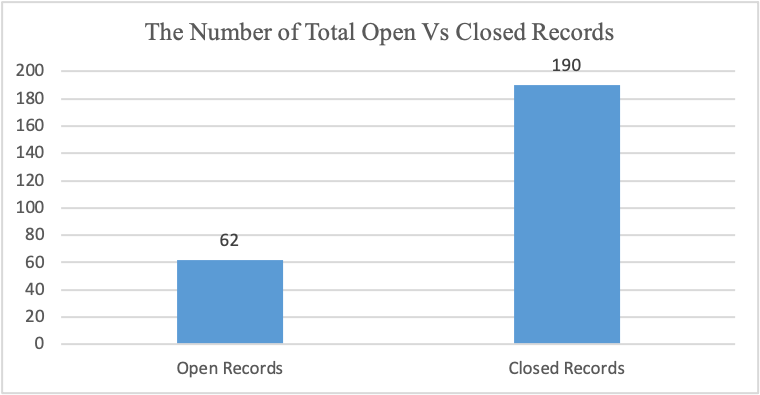
Figure 8
Figure 8 illustrates that since 2023, the pharmaceutical company has had about 62 open deviations and 190 closed deviations.
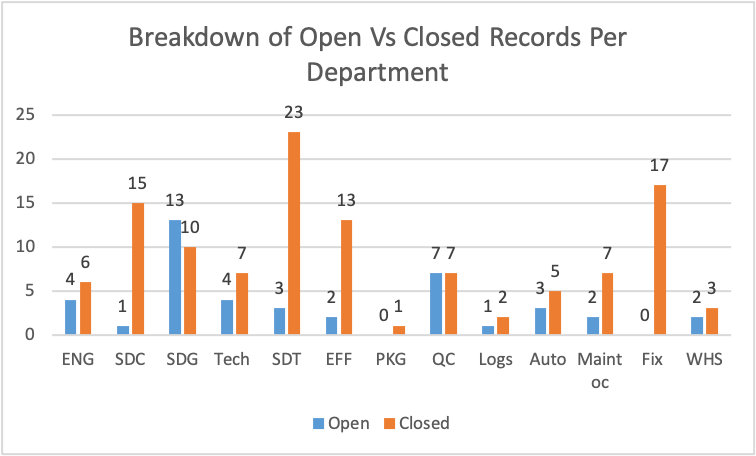
Figure 9
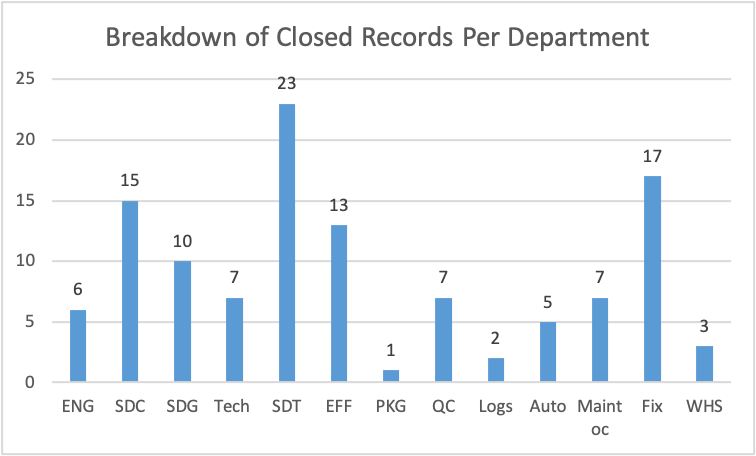
Figure 10
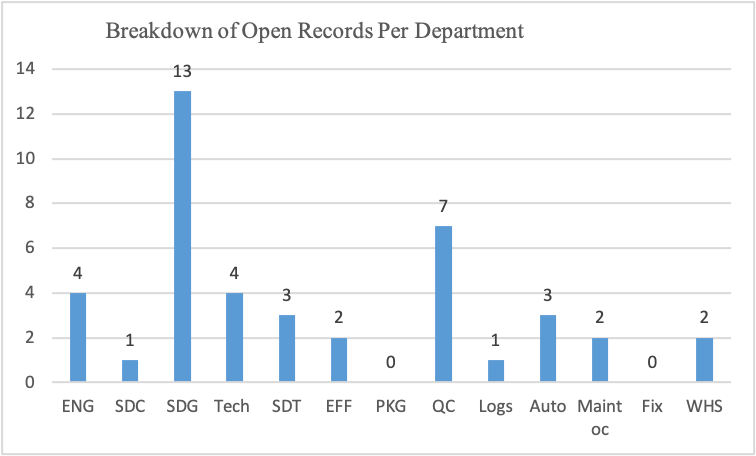
Figure 11
Figure 9 illustrates the breakdown of total open and closed records per department. According to the chart, SDT has the highest closed records, followed by Fix, then SDC. The Department of SDG has the highest number of open records, followed by QC. Additionally, the departments of PKG and Fix have no open records.
Deviations Settled on Time vs. delayed
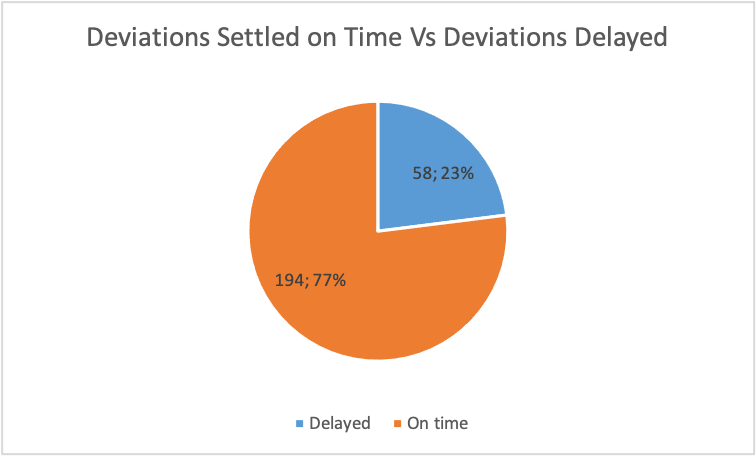
Figure 12
Figure 12 illustrates that 77% of deviations were settled on time, while the process for resolving the other 23% of deviations was delayed. Any overdue period above two days was considered as a delay.
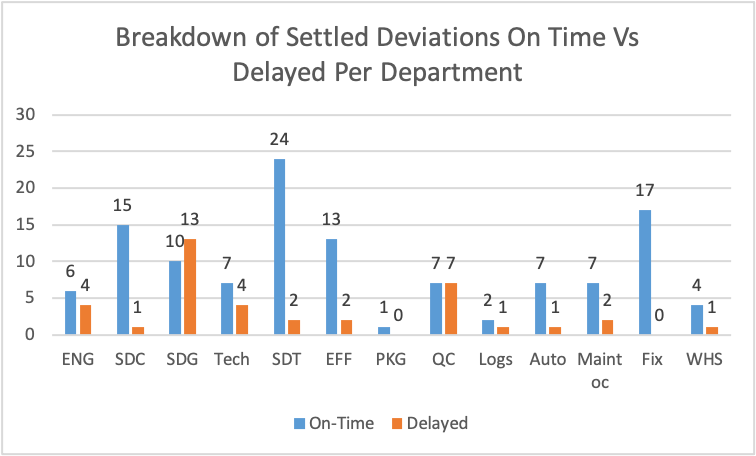
Figure 13
Based on Figure 13 results, from the issues raised, the SDG department had the highest number of delayed deviations followed by the QC department. The departments of Fix and PKG had no delayed deviations. From the deviations raised in all departments, the department of SDT has illustrated the highest on-time settling of deviation, followed by Fix, then SDC.
The Closure Time
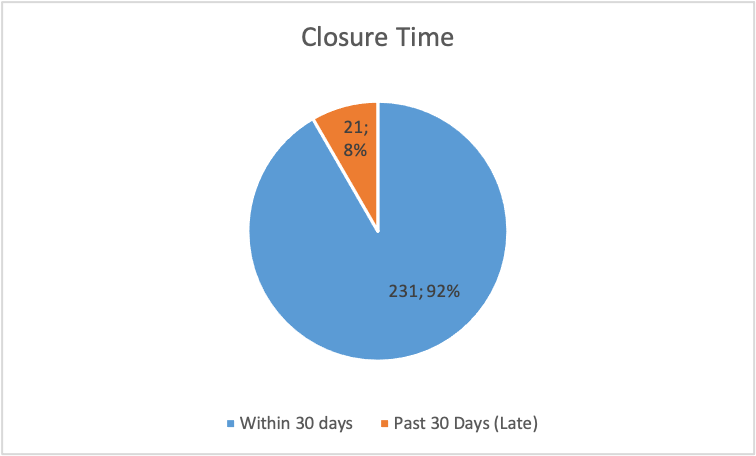
Figure 14
Figure 14 illustrates that 92 per cent of the deviations were settled before the closure time. Only 8% of the deviations were settled past the closure time.
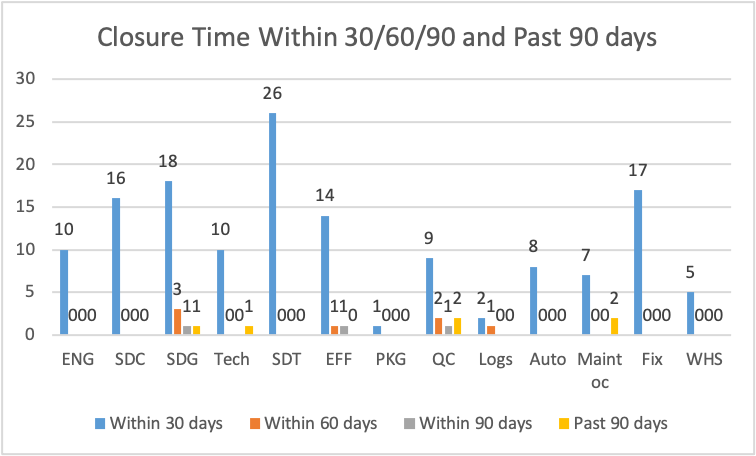
Figure 15
Figure 15 illustrates that department SDT completed most of its deviations within 30 days, followed by SDG, then Fix. Department of Maintenance, QC, Tech, and SDG had closure time for deviations above 90 days. There were about six deviations settled within the sixty days. The department of SDG settled 3, EFF settled one, QC settled two, and Logs settled one.
Deviations Closed on Time without an Extension
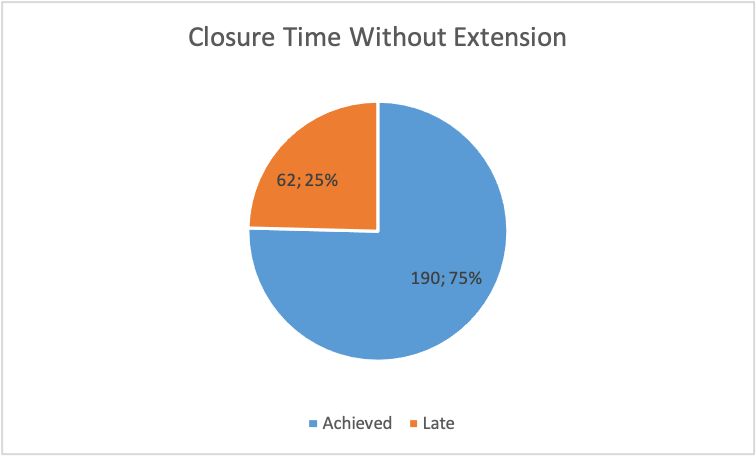
Figure 16
Figure 16 illustrates that without extension, about 75% of the deviations were settled on time, while 25% of the deviations were completed late.
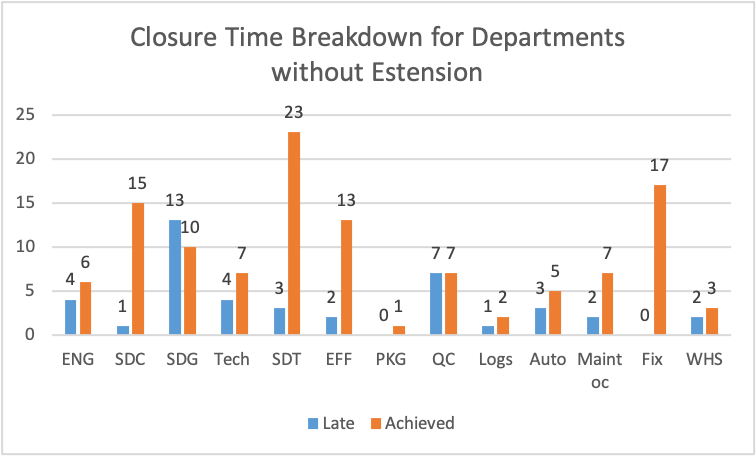
Figure 17
Figure 17 illustrates that SDT has the highest number of deviations closed without time extension requests. Department of Fix followed then SDC. Without extension requests, department SDG presented the highest amount of lateness in completing deviations, followed by department QC.
Conclusion
From the 252 deviations raised in the pharmaceutical company, about eight deviations were re-occurring, while 235 occurred once. Although creating an effective CAPA requires more than one root cause assigned to a department, when an organization settles the single root cause, it can minimize the reoccurrence of deviations. From the total 252 deviations raised in the company since 2023, the department of Tabletting had the highest number of deviations, followed by the department of Granulation. The Department of Packaging and Logistics had the lowest number of deviations of 2 and 3, respectively. From the eight re-occurring deviations, the department of SDT received the highest number of repeats.
Recommendations
The report has primarily analyzed deviations with repeat root causes besides highlighting non-reoccurring deviations. In managing the deviations, the following actions are effective. Programs like Quality Management Systems, training employees on maintaining the GMP requirements and Standard operating systems, and conducting root cause analysis are effective. The Quality Management System should be comprehensive and include processes effective in managing deviations and corrective and preventive actions. Also, training employees enhances competency among staff, thereby lowering deviations. The presence of a root cause analysis program helps in identifying and solving a deviation to minimize reoccurrence (Ito et al., 2022). Before developing a CAPA, an organization should identify the root causes.
Reference
Ito, A., Hagström, M., Bokrantz, J., Skoogh, A., Nawcki, M., Gandhi, K., … & Bärring, M. (2022). Improved root cause analysis supporting resilient production systems. Journal of Manufacturing Systems, 64, 468-478.
 write
write