Introduction
Rivalry exists among competitors. Companies that are in the same industry compete in different ways. Commonly, companies compete through prices, product innovation, and even services. As the competition among companies in the same sector escalates, their profits tend to decrease as companies are compelled to spend more money on maintaining the business. In other words, when there is stiff competition between companies, more money is paid to compete for the available market and look for new markets (Manoppo, 2016). Even though competition sometimes breeds innovation, some companies need help to sustain and ensure business continuity.
On the other hand, customers are the immediate beneficiaries of the competition among companies because they can purchase goods and services at a lower cost. In this report, I will analyze and evaluate two companies and tell how they have competed for over seven years. Also, I will include in my report actions that companies can take to outdo its competitor in the next two years, and this is more of a projection. I will use the companies’ earnings per share, returns on an entity, credit ratings, stock prices, and global trends in unit sales for the two companies to achieve my objectives.
Companies’ analysis
Earnings per share
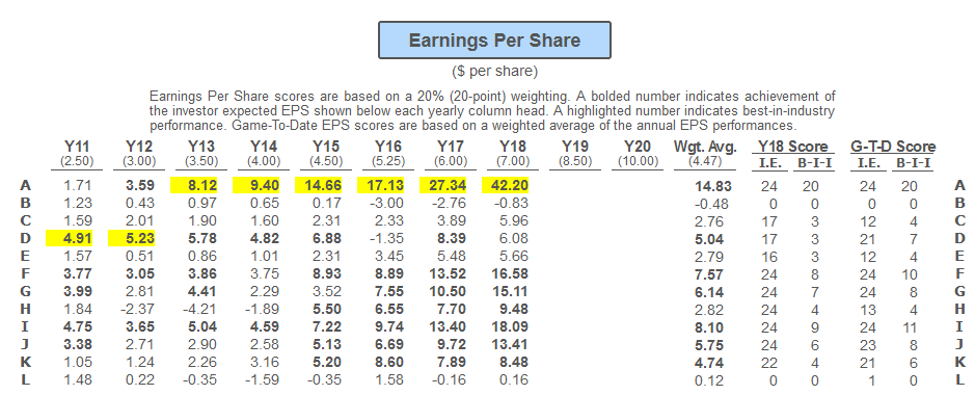
The two companies are assumed to compete in the same industry, meaning they deal in the same line of products. Secondly, the two companies sell in four regions: North America, Europe-Africa, Asia-Pacific, and Latin America. Furthermore, lastly, the two companies have operated for over seven years. Looking at the three factors mentioned, the companies compete in a fair market. The first factor for analysis is the earning per share for both companies. Earnings per share is the net profit divided by the number of shares outstanding at the end of the year. It is effective in analyzing and evaluating a company’s annual performance. For company A (Absolute Units), the company’s earnings per share have increased from year 11 to year 18. In year 11, the company’s Earnings per share were at 1.71. In year 18, the earnings per share were at 42.20. The numbers represent a positive trend throughout all the years. On the other hand, the earnings per share for Company L (Limited Luster Lacked) have decreased from year 11 to year 18. The same case applies to company B which registered a negative EPS in 2018. Even though there has been a slight increase in earnings per share for companies L and B, they have reported a negative trend.
An increase in earnings per share indicates that the company is making more profits to distribute to the shareholders. Also, a growth in EPS is a positive indicator of the company’s performance. Decreasing EPS, conversely, means that a company will need more dividends for its shareholders. This indicates poor performance. In terms of projection, Company A will likely do better in the next two years and the future if the trend is maintained. On the other hand, companies L and B will frustrate their shareholders and likely fall in the next two years. For companies L and B to par with company A, they should consider increasing their sales which leads to increased net profit, and reduce their share count by buying back their shares.
Return on equity
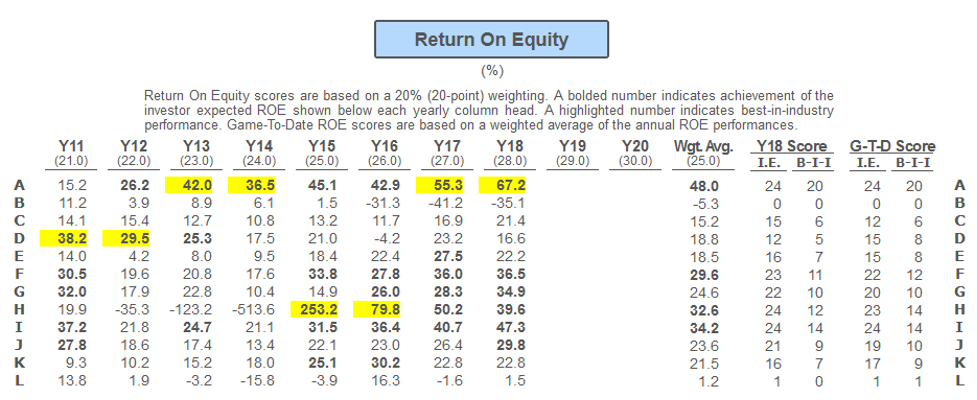
The second factor for analysis is the return on equity. Return on equity refers to the net profit divided by the average amount of shareholders’ equity investments in a specific year (Return on equity: Explained, 2023). ROE is one of the effective performance indicators for companies. In company A, it is plain that the company’s return on equity score has been on the rise since year eleven, which means that the company has had a positive ROE for eight years. A higher ROE is a signal that indicates that the company has efficiently used its shareholder’s equity to generate revenue.
On the other hand, companies L and B have had a decreasing ROE for the past eight years. Companies L and B have a negative trend as compared to company A. A low ROE for company L indicates it has been earning relatively minor compared to its shareholder’s equity. Company A trend on ROE shows that the company is performing well, especially in generating shareholder value (BSG decisions & reports, 2023). Also, the company is investing wisely, which is associated with increased productivity and profits. For Companies L and B to compete fairly in the market with Company A, they need to reduce the cost of their goods and services to sell more. Secondly, companies should consider investing in assets while reducing their liabilities. Also, they should consider reducing the number of shares in the open market (buyback) to improve the stock price. Tax savings and debt reduction can help in enhancing the company’s EPS.
Stock Price
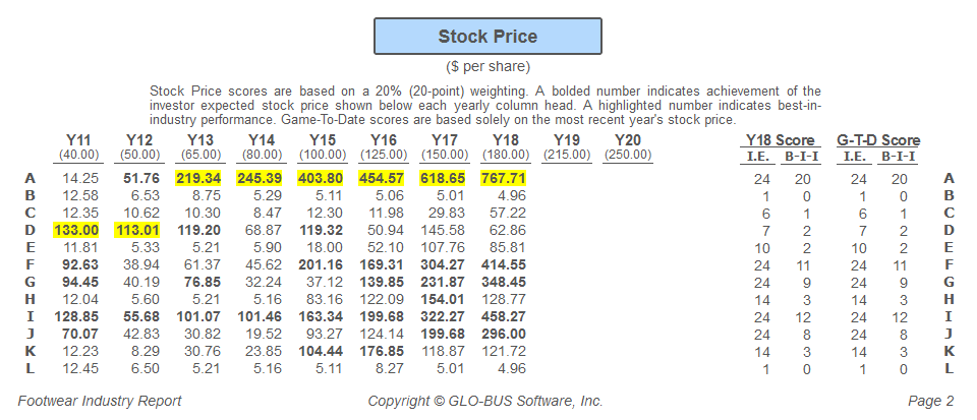
The third indicator is the company’s stock price. The stock price refers to the current price that a particular share of stock is trading at in the market. Public shares are assigned a price that reflects the value of the company. While the stock price can go up and down depending on economic and political factors, a higher stock price for company shares will always be recommended. All companies, A, B, and L, record different stock prices for eight years in the markets they have participated in. Company A has recorded an excellent global trend in its stock prices. In 2011, Company A’s stock price per share was 14.25; in 2018, the price was 767.71. Companies L and B have decreased stock price per share, from 12.45 in 2011 to 4.96 in 2018 and 12.58 to 5.01, respectively, regardless of both companies starting at almost the same price. For companies L and B to improve their stock price, they should consider buying back their stock to increase its value. Buying back their stock will convince potential investors that the company believes in its future performance (Five Ways to boost your company’s stock price, 2021). Secondly, the company should consider other strategies like merging with a successful organization, diversifying its portfolio, and restructuring it.
Other determinants.
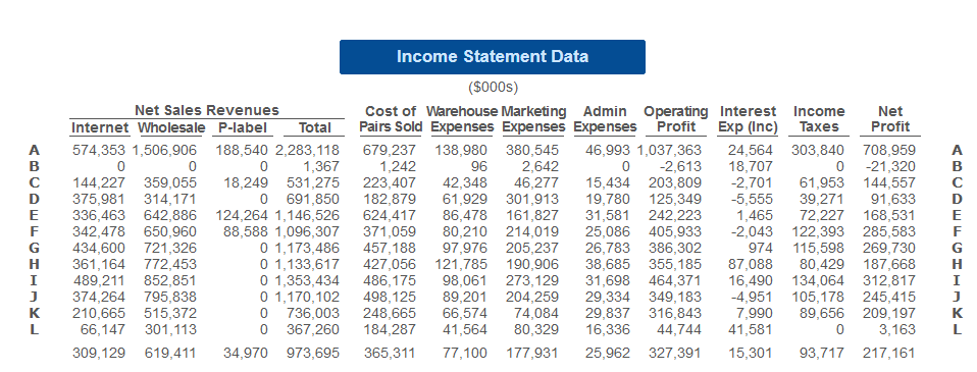
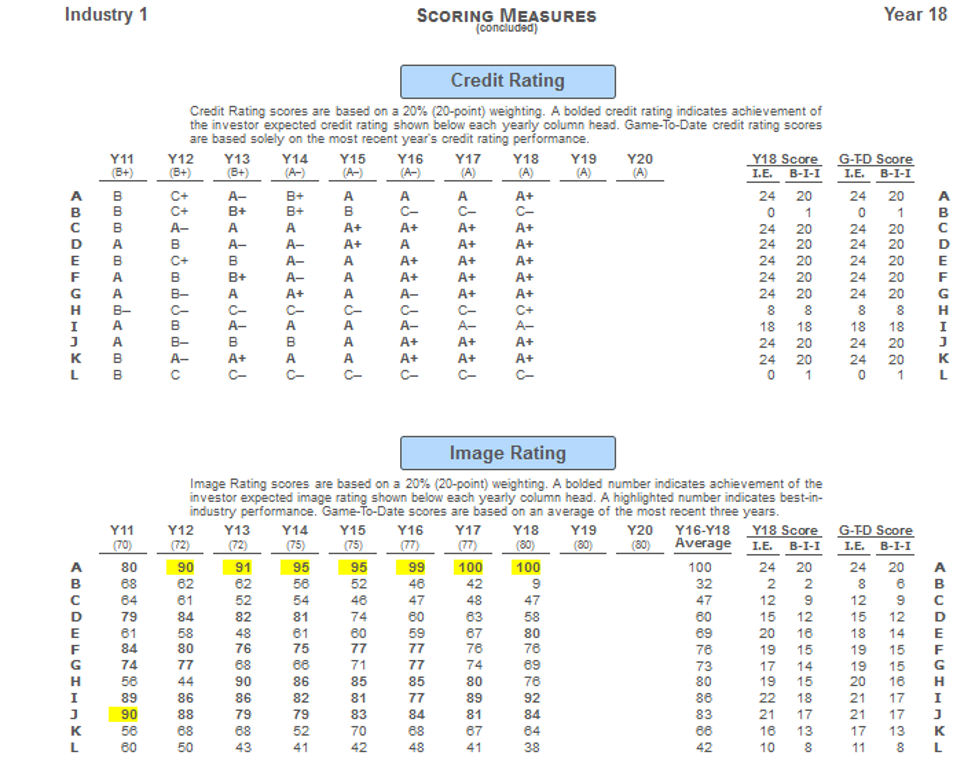
Other performance determinants are credit and image rating. Company A has a credit rating of A- while Company L has an accredited rating of C-. Company B started with an impressive credit rating but deteriorated after years. From the trend, Company L and B are likely to default on a loan if it has one. Company A, on the other hand, is likely to acquire debt and pay on time. The image rating for A and B follows the same trend as other determining factors. Company A has a good rating, thus, a better chance to improve in the next two years (Expectation=120) and the future. On the other hand, companies L and B have a decreasing company rating (expectation 35 and 30) in two years. To fix the underperforming companies’ poor image rating, they should review their branding quality in different regions (Orazalin et al., 2019). The two companies also recorded a significant difference in their sales revenue. In 2018, Company A had a net profit of 708,959, while Company L had a net profit of 3,163. Company L has been doing well in all regions compared to Company L for performance-based comparison purposes.
Conclusion
Overall, unlike Company A, companies L and B have been underperforming in all aspects that can be used to determine their performance. Unfortunately, the companies have recorded a negative global trend in their performance, which means they could collapse. Even though there are actions that Companies L and B can adopt to improve their performance, like diversifying their portfolio, buying back their shares, restructuring the company organization, improving their branding strategy, and related actions, there is no guarantee that their performance will improve overnight. The recommended actions are processes that will take time to implement and take effect. Furthermore, it does not guarantee that the efforts will give a positive outcome.
Tables Used
References
BSG decisions & reports. (2023). The Business Strategy Game – Competing in a Global Marketplace. https://www.bsg-online.com/users/program/v3/fir/page2
Five ways to boost your company’s stock price. (2021, November 25). Biostrategy Analytics. https://biostrategyanalytics.com/2013/08/28/5-ways-to-boost-your-companys-stock-price/
Manoppo, C. P. (2016). ROA, ROE, ROS, and EPS influence the stock price. Jurnal EMBA: Jurnal Riset Ekonomi, Manajemen, Bisnis dan Akuntansi, 3(4).
Orazalin, N., Mahmood, M., & Narbaev, T. (2019). The impact of sustainability performance indicators on financial stability: evidence from the Russian oil and gas industry. Environmental Science and Pollution Research, 26, 8157-8168.
Return on equity: Explained. (2023, April 14). Causal: The Business Planning Platform. https://www.causal.app/define/return-on-equity-c#
The Business Strategy Game – Competing in a Global Marketplace, www.bsg-online.com/api/docs/pdf/DEC-PerformanceProjections.
Updates, C. (2019, April 8). How to increase image rating in BSG? Medium. https://medium.com/@chandigarhupdates/how-to-increase-image-rating-in-bsg-ae590077559e
 write
write