House ownership has reduced more for some races and ethnicities compared to others in the cities of California cities and New York cities. Currently, Hispanic and Black residents are still far less likely than white residents to own their houses, 41.3 percent, and 47 percent, respectively, compared to 71.9 percent for whites. As a result, the ownership disparity for blacks and whites notably worsened after 2004. A study of mortgage-market statistics reveals some of the obstacles that black and Hispanic homeowners and would-be purchasers continue to encounter.
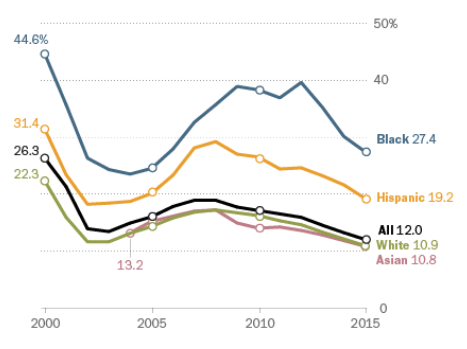
According to a study of data obtained from the federal Home Mortgage Accountability Act, 27.4 percent of black participants and 19.2 percent of Hispanic participants were rejected mortgages in 2015, in comparison to roughly 11 percent of white participants. In reality, blacks have been turned down for mortgage loans at greater rates compared to other races, during the housing upsurge, and restoration stages and Hispanics are turned down at increased rates than non-Hispanics.
The explanation outlined by lenders for rejecting some mortgage applicants displays a certain variation based on ethnic background. The commonly reported explanation for the rejection of conventional house loans amongst whites and Hispanics, for example, is that their debt to income ratios are too high (25 percent and 26 percent, accordingly). For the blacks, a low credit record of 31% is the most commonly stated cause. Even if rejection rates were the same, fewer blacks and Hispanics would be obtaining house loans since mortgage requests from these communities have dropped substantially. Considerably, just 132,000 black people sought conventional loans in 2015, compared to 1.1 million in 2005, despite the demand for mortgage among Hispania’s and blacks as shown.
The graph below outlines the rejection rates as of 2015 to show how hard it becomes for blacks and Hispania to get mortgages.
Not only is today’s candidate application less than in the past, but it also has a distinct racial and cultural make-up. In 2005, over 10% of conventional mortgage requests emerged from black residents; by 2015, that number had dropped to lower than 4%. Hispanics made around 14 percent of all applications in 2005, but just about 7% in 2015. From 2005 to 2015, the number of applications for conventional mortgages decreased by 69 percent altogether, but it fell 88 percent amongst blacks and 85 percent amongst Hispanics, compared to 66 percent for whites. On average, Blacks and Hispanics put down lesser payments on houses in relation to the total amount than other ethnicities.
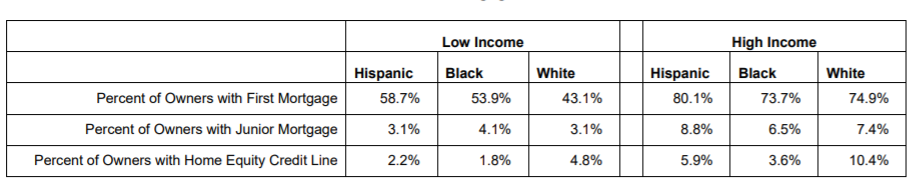
According to a second study in 2015 data from the American Household Surveys on mortgage-holding residents, more than half of Hispanic and Black homeowners announced making deposits of less than 10% of the household’s worth, compared to 37% of whites. Around a quarter of white residents, on the other hand, indicated deposits of 21% or more, compared to only 17% of Hispanics and 12% of blacks. The table below shows how Hispanics and blacks are more likely to pay higher mortgage rates in California and New York cities.
In contrary to 73 percent of white households, less than two-thirds of Hispanic and Black residents are still having mortgage rates under 5%. In comparison to 13 percent of white households, 23 percent of black owners, and 18 percent of Hispanic residents with mortgages are still spending more than 6 percent on their loans.
To be more specific, in 2019, Mortgage loans held by Black and Hispanic householders were around 60% of what would be predicted based on their demographic share in California. This disparity was observed for both high- and low-income neighborhoods. Black women make up 30% of the inhabitants in California, yet just 8% of house loans are given to them. In regional analyses, the trend continues. Although black people make up 7.8% of all inhabitants in the Los Angeles/Glendale metropolitan area, only 4% of house purchase loans were obtained in 2019. Black people make up 3.6% of people in the San Francisco/Redwood city, but only get 0.7% of mortgages. Comparatively, between 2002 and 2008, the population of Black householders in the city fell by 10%, from 210,000 to 189,000 due to discrimination. Approximately 60% of Black mortgage loans were from only three locations in 2019: portions of the northern Bronx, Central Brooklyn, and Southeastern Queens.
The bank as a solution to intervene for the black and Hispania households can at first, expand the availability of down payment help. Secondly, it can improve the availability of credit at a reasonable cost. It must therefore provide business credit and mortgage to disadvantaged, low-income, and minority homeowners and regions, considering the history of housing discrimination. Additionally, reinvesting and providing tax incentives aimed at these localities would aid in the rehabilitation and development of these areas. However, these expenditures must be thoughtfully planned to avoid displacing existing inhabitants and companies. Banks should also invest in affordable rental property. This is because capital investment in housing equality is important to addressing black households’ comparatively large financial constraints and housing insecurity. Above all, banks must follow and execute anti-discrimination regulations in mortgage lending, such as those found in the ‘Fair Housing Act and the ‘Equal Credit Opportunity Act (ECOA)’, both of which were enacted in 1974.
References
Turner M.A., and Skidmore F. (N.A). Mortgage Lending Discrimination: A Review of Existing Evidence. Available online: https://www.urban.org/sites/default/files/publication/66151/309090-Mortgage-Lending-Discrimination.PDF
 write
write