Economic Overview and Globalization, Currency Regime
Introduction
Japan is a country located on the East Coast of Asia. It has a population of 126.3 million people. The country, which covers 377 835 sq. km, has a $5.7 trillion and economic freedom score of 74.1, which makes it top ten among the Asian-Pacific region. Japan is one of the economic powers around the world since it is considered to have one of the largest and most developed economies (Currency History, 2015). The country’s economy rose after World War II because Japan was able to create cheap textile and later advanced to manufacturing and services and still accounts for most of the country’s employment and GDP.
Japan has high levels of globalization, and their products have high demand because it includes high technology exports; automobiles, electrical products, and gadgets. However, Japan’s globalization has been limited by agricultural protection in the country. By limiting the agricultural sector, Japan’s globalization is one-sided.
Over 40% of the manufactured products in Japan are exported to other countries. These products are mainly shipped to:
- United States – 20.2%
- China 17.5%
- Republic of Korea 7%
Japan’s Currency Regime
Japanese Yen (JPY) is currently the third most commonly traded currency in forex trade, where the first is the U.S. dollar and the second is Euro. Japan is one of the few countries that use the floating currency regime. Thus, the prices of imports and exports determine the most of the rate of foreign exchange. This policy has been in existence since the 1970s. Thus, the country has experienced massive fluctuations in the exchange rates. The value of the Japanese Yen around the 1940s was such that $1 was equal to ¥360. However, between the 1950s and 1960s, Japan underwent many adjustments due to the superfast growth of manufacturing industries (Meltzer, 1986). And by the 1980s, the system burgeoned due to capital inflows and foreign investments. The exchange rates fell from $1 equal to ¥360 to $1 was equal to ¥227 (Currency History, 2015). In 2008, during the economic crisis, the JPY exchange rates went up. Japan was able to reverse the situation using foreign exchange interventions. The exchange rates are not fixed and keep varying based on changes in demand and supply.
Immediate Past Currency System
Japanese Yen was invented in the 1870s. Before JPY, Japan used Mon (文) as the currency system from the 1330s up to the 1870s, and it continued to co-circulate with Yen currency up to 1891 (Fujii, 2013). The coins were made of 99% copper and had a hole in the middle. The coins were invented to replace barter trade and provided unit coins suitable for business, just like the Chinese coins.
Determination of the Exchange Rates and the Responsibility of the country authorities.
The current currency is JPY which the Bank of Japan controls. The supply of Yen is determined by the forces of demand and supply in the market. The higher the demand for Yen, the higher the exchange rate, which in turn increases the value of the Yen. This demand is due to increased trading activities between countries which increases the foreign exchange. Japan is highly globalized and manufactures products that have high demand worldwide (Meltzer, 1986). Thus, the more sales of products and services to other countries, the higher the exchange rates. Also, the vice versa is true where fewer sales result in less demand for the Yen, and thus, the exchange rates go down. The JPY is managed and controlled by the Bank of Japan. The institution ensures there is no high inflation or deflation, which would have a negative effect on the economy.
Balance of Payment.
Current Account:
Balance of Payment 2016 & 2015
| Goods | Services | Current Account Balance | |||
| Year | Import | Export | import | Export | |
| 2016 | 63,306 | 68,885 | 1.0 trillion | -1.0 trillion | 20649.6 billion yen |
| 2015 | 75,894 | 75,263 | 0.7 trillion | 0.1 trillion | 16412.7 billion yen |
The goods are measured indexes value, while the services are measured in their monetary value at that time. These goods mainly consist of; machinery, chemicals, automotive, electrical machinery, manufactured goods, and others (Okubo, 2021). On the other hand, the services are inclusive of travel, transport, and property charges. The goods have more positive results than the services due to the high demand for goods and offering free services as incentives. The current account balance is increasing, which is a sign that the country is more stable economically.
Capital account balance and financial account balance.
| Capital account balance | Financial account balance. |
| -6,579.728 | 134,603 |
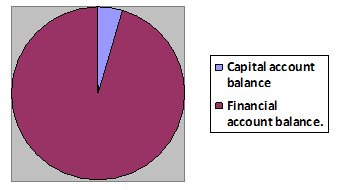
The chart above compares the components of liabilities of Japan to non-residentials (financial account) with the transactions that take place between Japan and other countries. Based on the presentation, the financial account balance is much more, indicating that Japan’s claims to non-residents are higher even when the transactions are much less (Okubo, 2021).
Official Reserves.
Japan’s 10-year BOP situation from 2011 up to 2021 has an average that indicates a gradual increase and a mean of over ¥1000 billion. The growth is an indication of a more stabilized economy. The most recent value is ¥1820.4 billion, which indicates that Japan can effectively meet the market expectations.
Currency Rate and Change.
Basic Currency Information
- Official Name: Japanese Yen
- Abbreviation: JPY
- symbol: ¥.
- Countries/ Region using the Currency: Japan in Asia
Exchange rate to U.S. dollar at two-time points – the beginning of last year and this year.
On January 1, 2020, the Yen value was USD 1 = ¥108.7136, and in January 2021, the exchange rate was USD 1 = ¥103.2426 (Olivier, 2021). This meant that I Yen was equal to 0.00964 US dollars in 2020, and the Yen value changed to 0.009686 by January 2021.
| Year | Direct Rate | Indirect Rate |
| January 2020 | USD 1 = ¥108.7136 | I Yen = 0.00964 USD |
| January 2021 | USD 1 = ¥103.2426 | 1 Yen = 0.009686 USD |
The Direction and magnitude of Change in Exchange Rate.
The rates: 1/ 108.7136= 0.0091985
The change from 2020 to 2021
1/103.2426=0.009686
Appreciation from Yen value: 103.2426-108.7136
= -5.471/ 108.7136 X 100= -(5.032%). This indicates a depreciation of the Yen value between 2020 and 2021.
It is important to note that as the value of one currency goes up, the other goes down. In this case, the projection indicates a future depreciation in Yen, meaning that the dollar’s value will go up by the same rate (5.032%).
The exchange rate change in the past ten years.
| Year | Japan / U.S. Foreign Exchange Rate |
| 2010 | 87.7817 |
| 2011 | 79.6967 |
| 2012 | 79.8180 |
| 2013 | 97.5971 |
| 2014 | 105.7398 |
| 2015 | 121.0491 |
| 2016 | 108.6569 |
| 2017 | 112.0986 |
| 2018 | 110.3974 |
| 2019 | 109.0188 |
| 2020 | 106.7754 |
Relative PPP and Forward/Future Rate.
Comparison of inflation rates of the U.S. and Japan.
Japan’s inflation level in 2020 was at its lowest, with a rate of 0.46%. This rate was very low compared to the United States inflation rate, which was at 1.25%. This indicates that the value of the U.S. dollar was going down in 2020 while the value of the Yen remained higher at a considerable rate. As noted earlier, the Japanese Yen is among the most potent currency in the world. The values indicate that the Japanese Yen currency is powerful, stable, and is being effectively controlled.
Tests of the Relative Purchase Power Parity.
In the findings of direction and magnitude found using calculations, the Yen value falls by 5.032% and the value of the dollar increases. On the other hand, the inflation levels collaborate when Japan’s inflation rate was -0.01% while that of the U.S., the value was at 1.25%.
-0.01-1.25 = -1.26% (-0.0126)
0.0125 +1= 1.0125
= -0.0126/1.0125
= -0.0124 (-1.24%)
This indicates that the RPPP in regard to the U.S. dollar is -1.24%. This value means that the Yen will gain value at a rate of 1.24% in respect to the U.S. dollar. Thus, the economy of Japan seems to be gaining power and stability compared to that of the United States economy. With a more stable currency, Japan has a higher purchasing power than United States values. This can be explained by the consumer price index, which is the primary determiner for inflation levels. A region with high inflation indicates that the cost of goods is high in the area, and when it is low, the price of products is more favourable. Thus, comparing the inflation rate between the United States and Japan, it is clear that Japan has more purchasing power compared to the United States.
Recent Prediction of forwarding Inflation Rate or Future Rate and Source of Information.
Trading Economics (2021) includes future forecasts of inflation rates up to 2023. The estimated inflation rate is around 0.50 in a year’s time. “In the long-term, the Japan Inflation Rate is projected to trend around 0.70 percent in 2022 and 1.40 percent in 2023, according to our econometric models.” (Trading economics, 2021).
References
Currency History. (2015, February 28). History of Japanese Yen | Currency History. Currency History | Worldwide Currencies History. https://currency-history.info/japaneseyen/
Fujii, N. (2013). The history of Japanese copper coins: Illustrated from the collection of the Currency Museum of the Bank of Japan. Journal of the Oriental Society of Australia, The, 45, 77-92.
Meltzer, A. H. (1986). Monetary and Exchange Rate Regimes: A Comparison of Japan and the United States. Cato Institute Journal. https://www.cato.org/sites/cato.org/files/serials/files/cato-journal/1986/11/cj6n2-14.pdf
Okubo, T. (2021, June 21). Balance of Payment Japan. Japanmacroadvisors.Com. https://www.japanmacroadvisors.com/page/category/economic-indicators/international-balance/balance-of-payment/
Olivier, J. P. (2021, January 2). 7.3: Exchange Rates and Currency Exchange. Mathematics LibreTexts. https://math.libretexts.org/Bookshelves/Applied_Mathematics/Business_Math_(Olivier)/07%3A_
Accounting_Applications/7.03%3A_Exchange_Rates_and_Currency_Exchange
TRADING ECONOMICS. (2021). Japan Core Inflation Rate | 1971–2021 Data | 2022–2023 Forecast | Calendar. https://tradingeconomics.com/japan/core-inflation-rate
 write
write