Research Question
Do students get higher grades while listening to music before and after studying?
Introduction and Rationale
Music is widely defined as arranging sound patterns to create a melody that delivers a message to an intended audience. The intended audience listens to the music produced using their gadgets, creating a personalized experience. Music can provide a soothing to the body, soul, and mind. Additionally, listening to music has been used as a coping mechanism for stress. People who listen to music when stressed tend to cool down after listening to it (Escobar et al., 4). The effectiveness of this coping mechanism with stress with music is almost parallel to doing excesses or sleeping when stressed. Research also indicates that music assists people in performing better under high-pressure situations.
Studies have also shown that students perform better when they listen to music during exam studying seasons. This is because music has been proven to improve cognitive reasoning by improving brain performance. Music tends to serve as a mental exercise for the brain, which trains it to better performance in the future. Burnout and high stress among students are routine, especially during exam studying seasons. Hence listening to music during exam studying seasons would reduce stress and improve focus. I have always been passionate about learning mathematical concepts involving real-life situations and listening to music. However, recently I came across research suggesting that listening to music during and after studying can boost students’ grades. Hence, I decided to investigate the validity of this claim using mathematical concepts such as correlation. Therefore, I focused my internal assessment on the correlation between students’ averages and listening to music before and after studying. The findings and outcomes of this investigation would be seductive to me since they will respond to my curiosity about whether the research suggests true.
The Aim and Hypothesis of the Investigation
This investigation aims to find the extent of association between students’ averages and music listening before and after studying. Hypothetically speaking, it is predicted that a solid correlation exists between listening to music and students’ averages. This relationship is because music tends to reduce the stress experienced in exam studying. The mathematical idea that would be utilized in investigating this association will be the idea of correlation. The concept of correlation has been primarily applied in statistics to determine the relationship between two measures of statistics. Commonly, correlation describes the association between more than one quantitative value. For instance, if one variable of statistics transposes, the other one will automatically transpose. Therefore, correlation assists in the determination of the mathematical difference between more than two quantitative measurables in real-life Scenarios.
The investigation would further entail the collection of data that would be employed in the mathematical analysis. The data will be collected from students who will be asked questions about their averages and whether they listen to music before studying. The field data would be vital in finding the statistical difference between music listening and higher grades performance. It would be imperative to define and state the null and alternative hypothesis of this investigation before proceeding to the part of data collection and analysis. The hypothesis is defined and stated as follows:
Null Hypothesis, H0: The student’s average is independent of listening to music before and after studying.
Alternative Hypothesis, H1: The student’s average depends on listening to music before and after studying.
The two main statistical ideas that will be applied to authenticate this claim are; chi-square computation, which assists in validating the stated hypothesis, and the simple regression approach, which will be employed by plotting the data of listening to music against students’ averages on a graph generated from excel. The simple regression value obtained will then be proved using the approach of the Pearson Concept. After stating and defining the hypothesis, it is essential to proceed to data collection.
Collection of data
It was vital to obtain data from the field investigation before advancing with mathematical exploration. The data was acquired from forty students who volunteered to provide information. They offered information concerning whether they listen to music before and after studying for exams. They also provided information concerning their averages which were helpful in the determination of whether listening to music influenced their grades. During the data collection process, those who listen to music were denoted with numerical figure 1, while those who do not were denoted with numerical figure 0. This denotation process was done to assign numerical statistics to music listening. The students also provided positive feedback that listening to music before and after studying for exams improved their performance and concentration. This positive feedback was crucial in the field investigation since it supported the projection of the analysis. The data collected from the field investigation was tabulated in the table below.
Table 1: Raw data collected: music listening and students’ averages
| No students | Music listening | Students averages |
| 1 | 1 | 81 |
| 2 | 1 | 84 |
| 3 | 0 | 77 |
| 4 | 0 | 76 |
| 5 | 1 | 84 |
| 6 | 1 | 91 |
| 7 | 0 | 79 |
| 8 | 1 | 94 |
| 9 | 1 | 88 |
| 10 | 0 | 74 |
| 11 | 0 | 79 |
| 12 | 0 | 71 |
| 13 | 1 | 95 |
| 14 | 1 | 79 |
| 15 | 1 | 86 |
| 16 | 1 | 79 |
| 17 | 1 | 81 |
| 18 | 0 | 81 |
| 19 | 1 | 86 |
| 20 | 1 | 87 |
| 21 | 1 | 88 |
| 22 | 1 | 79 |
| 23 | 0 | 82 |
| 24 | 1 | 89 |
| 25 | 0 | 71 |
| 26 | 1 | 85 |
| 27 | 0 | 74 |
| 28 | 1 | 86 |
| 29 | 1 | 86 |
| 30 | 1 | 92 |
| 31 | 1 | 87 |
| 32 | 0 | 77 |
| 33 | 1 | 88 |
| 34 | 1 | 86 |
| 35 | 1 | 86 |
| 36 | 1 | 95 |
| 37 | 1 | 94 |
| 38 | 1 | 89 |
| 39 | 1 | 96 |
| 40 | 1 | 81 |
It was essential to test the rationality of the hypothesis with the chi-square concept, Pearson approach, and simple regression concepts of correlation after data collection.
Chi-Square Approach
After collecting the information, it is important to calculate the Chi-square. The chi-square computation assists in the selection of the stated hypothesis and is computed by the following formulae:
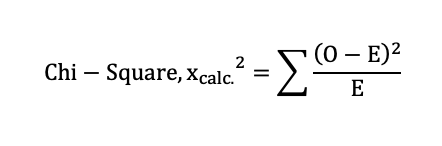
Where;
Chi-square determination involves the affirmation of a hypothesis where the mathematical value of the chi-square is calculated out through the deployment of the contingency table. The obtained critical value of the chi-square will then be calculated using the chi-square distribution table and later compared with the previously obtained mathematical value. The null hypothesis will be chosen if the observed critical value exceeds the calculated mathematical value. The selection of the null hypothesis would indicate that students’ averages are independent of music listening before and after studying. If the results are opposite, the second hypothesis will be picked, indicating that the student’s averages depend on music listening before and after learning.
The data in table 1 were utilized to create a contingency table of 2 by 3 for calculating the observed student’s average values organized in terms of quartiles, and music listening data were arranged in terms of the median. The observed values for music listening and student averages are tabulated in table 2 below.
Table 2: Observed Values of students’ averages
|
Music listening |
Students averages | |||
| Total | ||||
| 75.33 | 81.5 | 0 | 156.83 | |
| 79 | 85.29 | 93.14 | 275.43 | |
| Total | 154.33 | 166.79 | 93.14 | 414.26 |
The calculated expected values of the student’s averages are calculated utilizing the summation of values listed in table 2 as shown below:

Table 3: Expected Values of student’s averages
| Mean of students’ averages | ||
| 58.43 | 62.942 | 35.261 |
| 102.61 | 110.89 | 61.93 |
| 161.04 | 173.832 | 97.191 |
The chi-square mathematical value would then be generated by utilizing outcomes in tables 2 and 3 above;
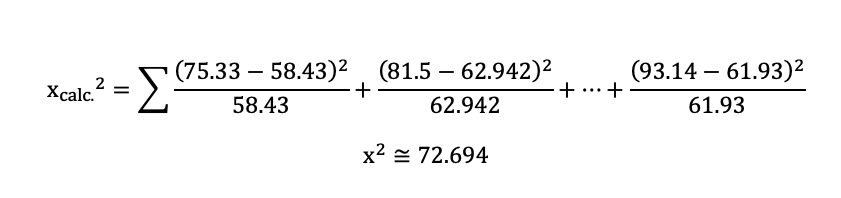
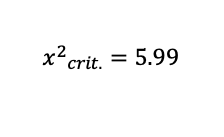
The chi-square critical value is then worked out from the distribution chi-square table using a significance extent of 0.05 and the value of the degree of freedom of;
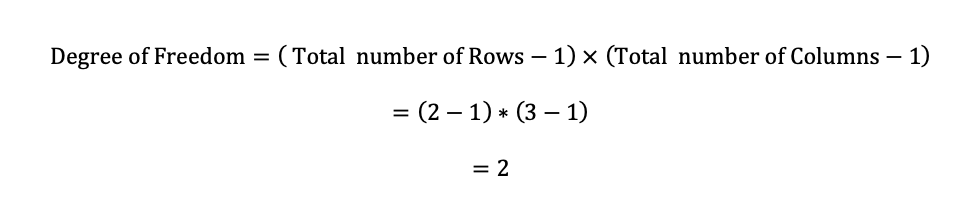
The chi-square critical value was found to be 5.99
Comparison of the calculated mathematical chi-square value and observed critical chi-square value;
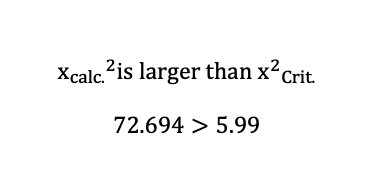
According to the outcomes above, the alternative hypothesis was chosen, and the null hypothesis was disregarded, indicating that the student’s averages depend on listening to music before and after studying. This selection of alternative hypotheses supports the claim of the investigation, which states that listening to music can contribute to higher grades among students.
Evaluation of Correlation Utilizing Linear Regression Approach
The simple regression concepts allow one to examine the relationship between two statistical variables on a plotted graph. Regularly, the dependent measure is plotted against the independent measure utilizing analytical tools such as Excel. The plot generated is used to evaluate the simple linear constant, which shows the strength of the correlation. In case the value of correlation generated from the plotted graph is 0 or gravitates to zero, then the association between the two measurable is very fragile (Nickolas 20). On the other hand, if the value of correlation generated tends to be one or greater than 0.5, then the strength of correlation between the two variables is positive. Alternatively, the relationship’s power will be harmful if the correlation value is -1 or gravitates to -0.5. The music listening and student averages data were utilized to produce a graph from Excel software, as illustrated in graph one below.
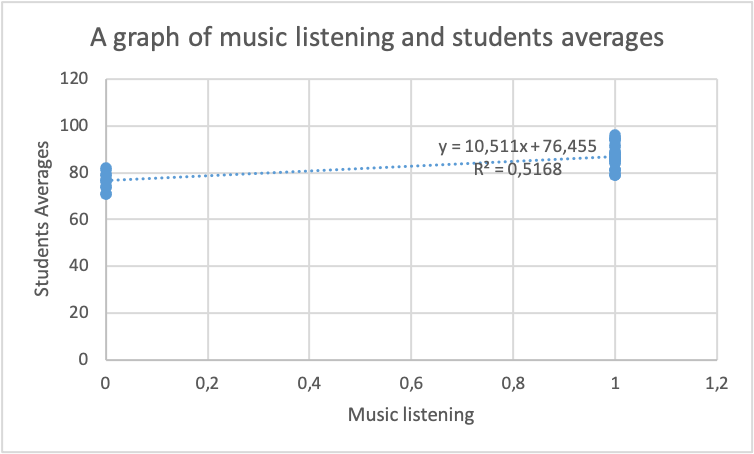
From the excel scatter graph above, the simple regression constant was generated as follows;
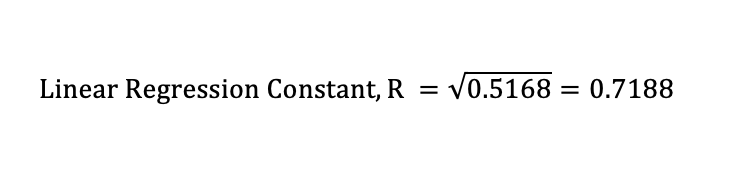
The positive, simple regression value of 0.7188 indicates a strong association between listening to music and students’ averages. This support furthers the hypothesis that listening to music before and after studying the exams boosts students’ grades. Nevertheless, it is vital to validate the outcomes by deploying the Pearson approach.
Calculation of Correlation value utilizing the Pearson Approach
The method of Pearson approach is employed to validate the value of correlation determined through the simple regression idea. The value of the Pearson constant can be obtained using the deployment of the formula below;
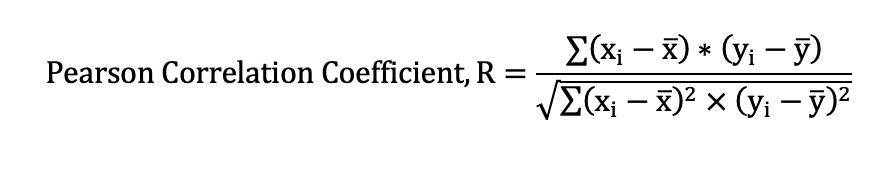
Where;
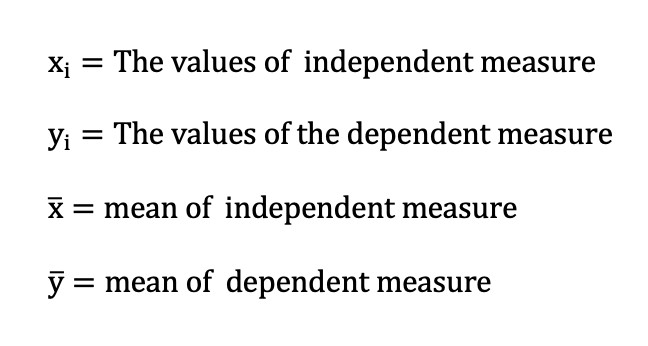
The independent measure (x) would be taken as music listening values. In contrast, the dependent measure (y) would be taken as the student’s average values in the determination of the value of the Pearson correlation. The following table indicates Pearson values generated using excel software.
Table 4: Pearson Table: Music listening and students’ averages
| 1 | 81 | 0.275 | -3.075 | 0.075625 | 9.455625 | -0.84563 |
| 1 | 84 | 0.275 | -0.075 | 0.075625 | 0.005625 | -0.02063 |
| 0 | 77 | -0.725 | -7.075 | 0.525625 | 50.05563 | 5.129375 |
| 0 | 76 | -0.725 | -8.075 | 0.525625 | 65.20563 | 5.854375 |
| 1 | 84 | 0.275 | -0.075 | 0.075625 | 0.005625 | -0.02063 |
| 1 | 91 | 0.275 | 6.925 | 0.075625 | 47.95563 | 1.904375 |
| 0 | 79 | -0.725 | -5.075 | 0.525625 | 25.75563 | 3.679375 |
| 1 | 94 | 0.275 | 9.925 | 0.075625 | 98.50562 | 2.729375 |
| 1 | 88 | 0.275 | 3.925 | 0.075625 | 15.40563 | 1.079375 |
| 0 | 74 | -0.725 | -10.075 | 0.525625 | 101.5056 | 7.304375 |
| 0 | 79 | -0.725 | -5.075 | 0.525625 | 25.75563 | 3.679375 |
| 0 | 71 | -0.725 | -13.075 | 0.525625 | 170.9556 | 9.479375 |
| 1 | 95 | 0.275 | 10.925 | 0.075625 | 119.3556 | 3.004375 |
| 1 | 79 | 0.275 | -5.075 | 0.075625 | 25.75563 | -1.39563 |
| 1 | 86 | 0.275 | 1.925 | 0.075625 | 3.705625 | 0.529375 |
| 1 | 79 | 0.275 | -5.075 | 0.075625 | 25.75563 | -1.39563 |
| 1 | 81 | 0.275 | -3.075 | 0.075625 | 9.455625 | -0.84563 |
| 0 | 81 | -0.725 | -3.075 | 0.525625 | 9.455625 | 2.229375 |
| 1 | 86 | 0.275 | 1.925 | 0.075625 | 3.705625 | 0.529375 |
| 1 | 87 | 0.275 | 2.925 | 0.075625 | 8.555625 | 0.804375 |
| 1 | 88 | 0.275 | 3.925 | 0.075625 | 15.40563 | 1.079375 |
| 1 | 79 | 0.275 | -5.075 | 0.075625 | 25.75563 | -1.39563 |
| 0 | 82 | -0.725 | -2.075 | 0.525625 | 4.305625 | 1.504375 |
| 1 | 89 | 0.275 | 4.925 | 0.075625 | 24.25563 | 1.354375 |
| 0 | 71 | -0.725 | -13.075 | 0.525625 | 170.9556 | 9.479375 |
| 1 | 85 | 0.275 | 0.925 | 0.075625 | 0.855625 | 0.254375 |
| 0 | 74 | -0.725 | -10.075 | 0.525625 | 101.5056 | 7.304375 |
| 1 | 86 | 0.275 | 1.925 | 0.075625 | 3.705625 | 0.529375 |
| 1 | 86 | 0.275 | 1.925 | 0.075625 | 3.705625 | 0.529375 |
| 1 | 92 | 0.275 | 7.925 | 0.075625 | 62.80563 | 2.179375 |
| 1 | 87 | 0.275 | 2.925 | 0.075625 | 8.555625 | 0.804375 |
| 0 | 77 | -0.725 | -7.075 | 0.525625 | 50.05563 | 5.129375 |
| 1 | 88 | 0.275 | 3.925 | 0.075625 | 15.40563 | 1.079375 |
| 1 | 86 | 0.275 | 1.925 | 0.075625 | 3.705625 | 0.529375 |
| 1 | 86 | 0.275 | 1.925 | 0.075625 | 3.705625 | 0.529375 |
| 1 | 95 | 0.275 | 10.925 | 0.075625 | 119.3556 | 3.004375 |
| 1 | 94 | 0.275 | 9.925 | 0.075625 | 98.50562 | 2.729375 |
| 1 | 89 | 0.275 | 4.925 | 0.075625 | 24.25563 | 1.354375 |
| 1 | 96 | 0.275 | 11.925 | 0.075625 | 142.2056 | 3.279375 |
| 1 | 81 | 0.275 | -3.075 | 0.075625 | 9.455625 | -0.84563 |
| Totals | 7.975 | 1704.775 | 83.825 |
The correlation coefficients are then computed using the following formulae:
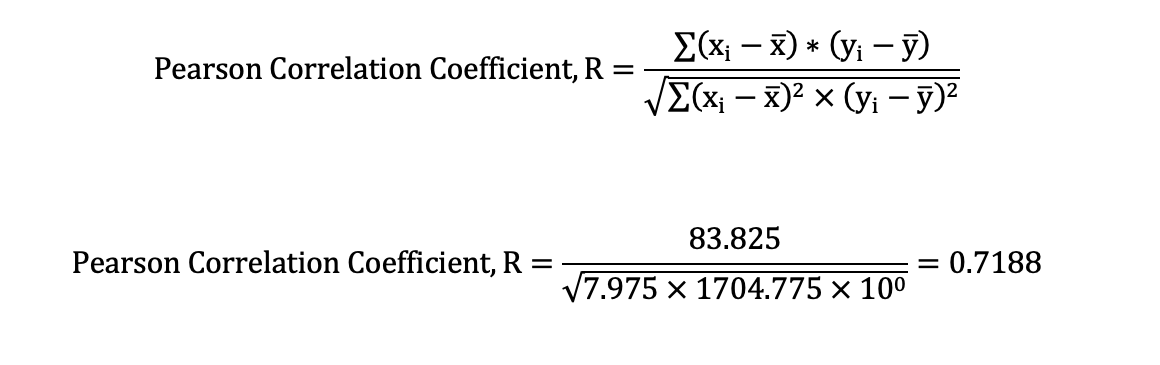
The Pearson correlation value obtained was 0.7188, which authentic a solid correlation between music listening and students’ averages. Hence, listening to music is associated with higher grades, and students can listen to music during exams studying season to boost their focus and performance. It is possible to model the relationship between listening to music and the student’s averages since all the correlation coefficients obtained were more significant than 0.5. The linear model was obtained as follows:
The linear regression model can be obtained using the following equation.
Where y represents the dependent measure, x is the independent measure while b is the inclination of the line, and is the y-intercept
The values of a and b were calculated as follows:
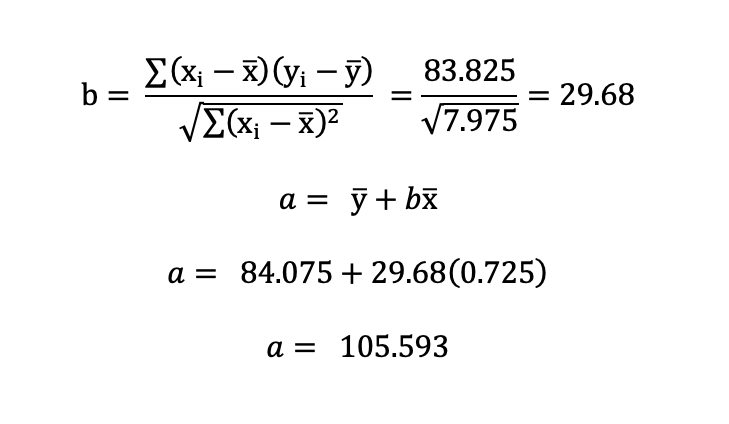

Hence, the student’s average can be determined given the numerical figure of music listening using the above equation generated. With this equation, one can determine the average score at a given exam session depending on how well they utilize music listening to boost their cognitive studying. Therefore, from the finding and analysis of the investigation, it was seen that music listening during studying is associated with higher grades. Therefore, students can listen to music when they experience burnout or stress before studying for exams.
Culmination and Evaluation
This statistical investigation focused on determining the correlation between music listening and students’ averages. First, it was believed that a solid association exists between music listening and students’ average values. The chi-square computation was first applied to test the validity of the hypotheses stated and defined. Secondly, the simple regression idea was utilized to calculate the association difference. Subsequently, the Pearson idea was utilized to validate the authenticity of the value calculated from the simple regression idea. The findings and mathematical outcomes proved that the association between music listening and students’ averages was robust. This relationship indicated that listening to music while studying contributes to students’ higher grades. It was also possible to obtain a model since all values of coefficients were above 0.5. The regression model can determine the students’ average given the numerical figure of how they utilize music during their study period. Hence, the exploration hypothesis and aim were achieved, indicating that listening to music before and after studying can significantly improve students’ averages.
The strengths of the exploration were obtained from the large amount of data obtained from volunteer students, which strengthened the hypothesis’s validity. Another source of strength was the Use of methods of correlation in the determination of the values of correlation which supported the validation of the investigation. Nevertheless, one source of the shortcoming was the approximation of figures that might have reduced the authenticity of the exploration. The analysis and the outcome of the investigation were sufficient to prove the claim of the research, which fulfilled my curiosity. The outcomes of the exploration can also be applied in other areas, such as the application of music in emotional development. From the analysis, it is evident that music is of great advantage to students in their learning and thus can be applied to reduce stress among students. Hence, higher grades correlate with listening to music before and after studying. Therefore, students should listen to music during their studying period to boost their grades and performance.
Works Cited
Escobar, Jillian, Bruna S. Mussoi, and Amanda B. Silberer. “The effect of musical training and working memory in adverse listening situations.” Ear and hearing 41.2 (2020): 278-288.
Nickolas, S. “What do correlation coefficients positive, negative, and zero means.” (2021).
 write
write