Research question
What are the impacts of an increase in temperature on aspirin concentration?
Introduction and Rationale
The objective of the investigation is to evaluate how increased temperatures affect aspirin concentration. Temperature is one of the key factors that alter the reaction rate in most chemical reactions and can be used to evaluate the strength of the bond present. Temperature tends to increase the kinetic energy of particles when heated, which makes the particles collide at a faster rate. On the other hand, concentration can also alter the reaction rate if one of the concentrations of the reactant is increased. Hence, it is vital to check the association between temperature and concentration in drugs such as aspirin.
My interest in exploring this topic began when I remembered how My mother used to dissolve aspirin in water because I had a hard time taking aspirin which was the same thing her mother used to do to her. This process made me curious about whether temperature had an impact on the concentration of aspirin. Therefore, combining my curiosity and passion for chemistry, I decided to focus my internal assessment on the impact of increased temperatures on aspirin concentration. The outcomes of this investigation would be seductive to me since they answer my curiosity.
Brief theoretical background
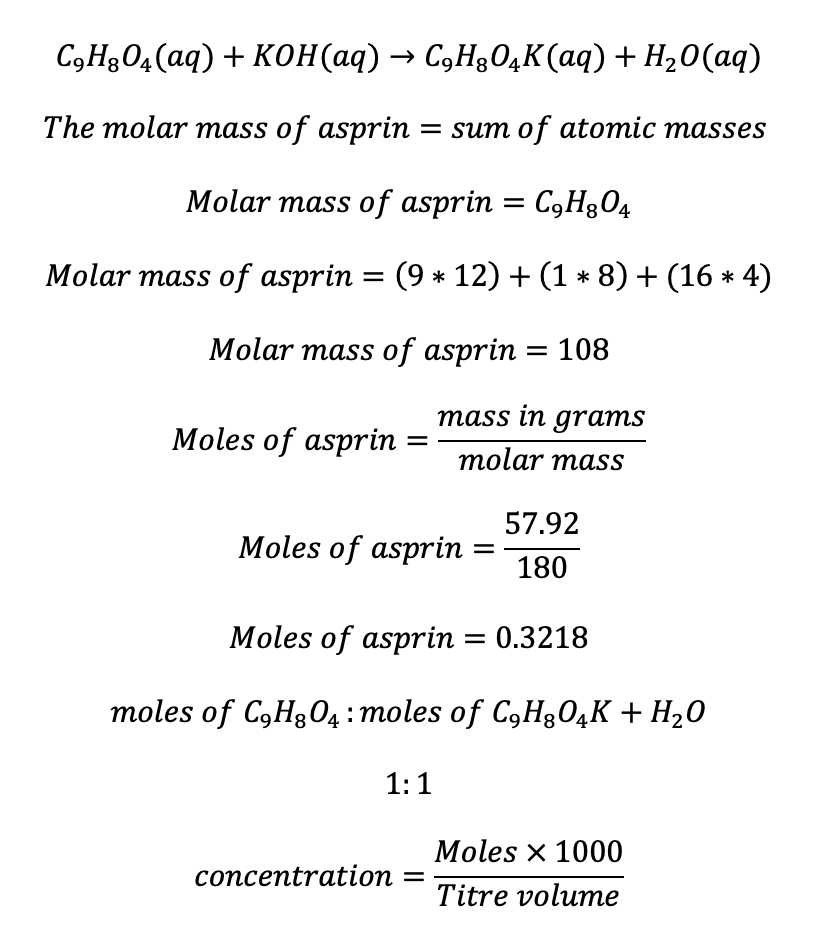
Asprin is an acidic substance used in most cases as a pain reliever. Asprin contains both ester and carboxylic acid functional groups and is slightly soluble in water. Asprin can be prepared by reacting acetic anhydride and salicylic acid in the presence of an acid catalyst. Potassium hydroxide has been used in most instances to stabilize aspirin solution. The reaction between aspirin and potassium hydroxide can be illustrated in the following equation.
Temperature tends to escalate the aspirin concentration because an increase in temperature causes constrain in the equilibrium condition. However, the constraint is reduced because heat is consumed during the dissolving process, which causes an increase in concentration.
The hypothesis of the investigation
Hypothetically speaking, it is believed that an escalation in the temperature would yield an increase in the concentration of aspirin. It is also expected that the relationship between temperature and aspirin concentration would be directly proportional. This increase in the aspirin concentration is because an increment in temperature causes constrain in the equilibrium condition. However, the constraint is reduced because heat is consumed during the dissolving process, which increases the concentration. The hypothesis claim would be tested by heating aspirin solution at increased temperatures using an electric hotplate and titrating it with potassium hydroxide. The dataset obtained will later be plotted in excel graphical software, and the regression constant will be obtained to show the magnitude of the relationship. After stating the hypothesis, it was essential to define the variables of the investigation before conducting data collection and analysis.
Variables and reason for control
The following table contains variables used in this investigation, the method of control, and the reason for control. The variables were essential since they enabled sufficient testing and proving of the hypothesis.
Table 1:Variables used and reason for control
| Variable Type | Control | Method | Reason for control |
| dependent variable | The temperatures for aspirin solution | The temperatures were raised in the interval range of (20,30,40,50,60) aspirin solution in the respective trials. | The variable was used to evaluate how different temperatures alter the concentration of aspirin. |
| Independent variable | The concentration of aspirin | The concentration was determined by obtaining the moles of respective titre volumes. | This was done to evaluate how concentration is affected by increased temperature. |
| Controlled variable | The mass of aspirin and potassium hydroxide | The mass of aspirin was kept at a constant mass of 57.92 grams, and that of potassium hydroxide at 32.2 grams for the whole experiment. | This was done to ensure the concentration of the reactant remained the same. |
| Controlled Variable | The volume of water | The potassium hydroxide and aspirin solution were diluted with 150 ml of water for all trials | volume has an effect on the concentration, which increases the inaccuracy of data collection |
Materials and Apparatus
The followings are the materials and apparatus that were used in this investigation :
- Potassium hydroxide pellets
- Cold water
- Asprin tablets
- Pen
- Worksheet
- Eye protection
- Beaker
- Conical flask
- Stirring rod
- Weighing balance
- Funnel
- Electric hotplate
- Erlenmeyer flask
- Ring stand
- Burette clamp
- volumetric
- laboratory manual
Experiment setup
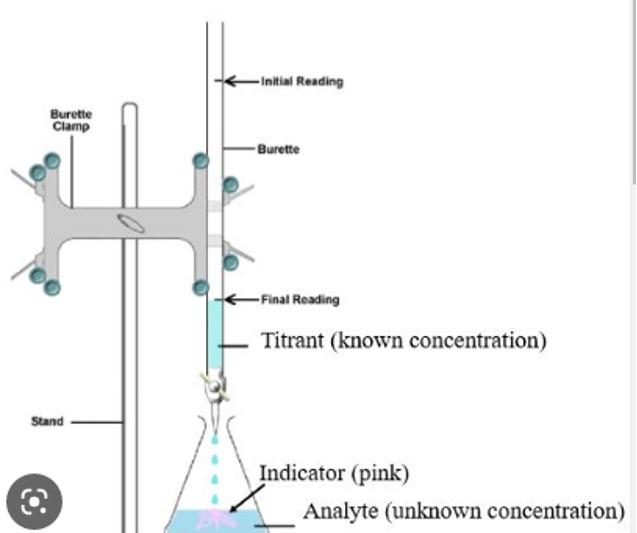
The following diagram illustrates the setup of the experiments that were done in order to collect the data that would be used in this investigation.
Procedure and methodology
- Assemble all the necessary materials and apparatus in the workstation
- Read the laboratory manual before conducting the experiments
- Dry an Erlenmeyer flask first before placing potassium and aspirin pellets
- Place 57.92 grams of aspirin tablets inside the Erlenmeyer flask.
- Pour 150 ml of water into a flask containing the aspirin tables.
- Stir the solution until the tablets have dissolved completely in the water.
- Put the solution of aspirin into an electric hot plate
- Raise the temperatures in intervals of (20°C,30°C,40°C,50°C, and 60°C)
- Dissolve 32.5 grams of potassium hydroxide in water
- Stir gently until all the pellets are dissolved completely
- Apply suction filtration for both aspirin and potassium hydroxide solution
- Record the volumes of titres and tabulate them
- Repeat the procedure for the other four trials and tabulate their volume readings.
- Add around four drops of phenolphthalein indicator and stir gently to mix the content. Observe the change in colour.
- Pour the coloured solution obtained into the sink.
- Reinse all the apparatures
Safety procedure and Precaution
The reaction between aspirin and potassium hydroxide solution is corrosive and should be handled with care. Ensure to put on gloves, lab coats, and goggles throughout the experiment to protect the skin and eyes from the reactions. Rinse all the apparatus and ensure to dispose of the products properly after the experiments have been conducted.
Qualitative data analysis
The phenolphthalein indicator’s colour changed from colourless to pink to the formation of the acidic solution after titration. The temperature reading was observed to increase due to the heat production between the two reactants. The volume of the titres was also noted to increase with the increase in temperature.
Data collection
The following table indicates the set of data that was collected from the experiment. The main set of data that was collected was about the temperature of the aspirin solution after it was subjected to an electric hotplate, and the titre volumes were also recorded after titration. The data recorded was fundamental in evaluating the concentration of aspirin.
Table 2: Data collected
| Temperature (±0.01 | Titre volumes(m/l)(Trials) ±0.01 | ||||
| 1 | 2 | 3 | 4 | 5 | |
| 20 | 9.5 | 9.6 | 9.5 | 9.4 | 9.5 |
| 30 | 9.3 | 9.2 | 9.3 | 9.4 | 9.3 |
| 40 | 8.8 | 8.7 | 8.9 | 8.8 | 8.8 |
| 50 | 8.6 | 8.7 | 8.5 | 8.6 | 8.6 |
| 60 | 8.4 | 8.5 | 8.4 | 8.3 | 8.4 |
After the data was collected, it was essential to calculate the average titre values of the trials. The following formulae were used to obtain the average titration for the five trials in seconds:

For instance, the average titration for the 20 degrees Celcius interval was determined as follows and the concept utilized to obtain the average for the other titration volumes:

Table 3: Processed data: Average titre volumes
| Temparature(±0.01 | Average titre volumes(m/l) ±0.01 |
| 20 | 9.5 |
| 30 | 9.3 |
| 40 | 9.8 |
| 50 | 8.6 |
| 60 | 8.4 |
The concentration was computed by utilizing the equation formed after the reaction of aspirin and potassium hydroxide as follows:
For instance, the concentration for the 9.5m/l titre was computed as follows and concepts utilized for the rest of the titres:
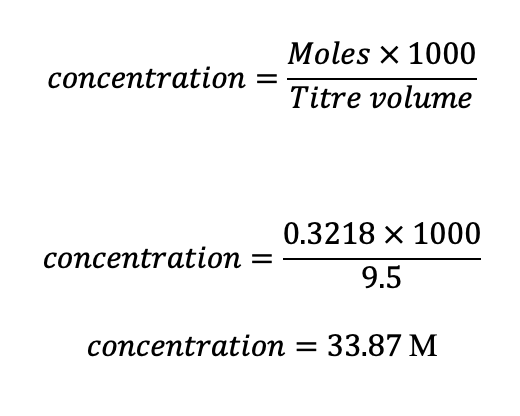
Table 4: Processed data: The calculated concentration
| Temperature(±0.01 | Concentration(M) ±0.01 |
| 20 | 33.87 |
| 30 | 34.60 |
| 40 | 32.84 |
| 50 | 37.42 |
| 60 | 38.31 |
After the concentration was computed and tabulated in table 4 above. The data was plotted using excel software in order to evaluate the relationship between temperature and concentration, as shown in the figure below:
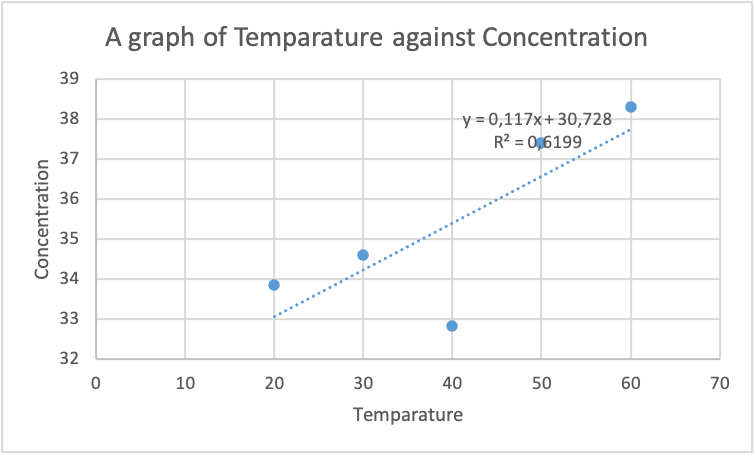
From the graph in figure 1 above, it can be evidently seen that the relationship between the temperature and concentration is directly proportional. An escalation in the temperature of aspirin results in an increment in the concentration. This increase in the concentration of aspirin is because an increment in temperature causes constrain in the equilibrium condition. However, the stress is reduced because heat is consumed during the dissolving process, which increases concentration. The regression constant obtained of 0.7873 support further the claim by demonstrating the solid relationship between temperature and concentration. Hence, the impact of temperature on the concentration of aspirin is significant.
Uncertainty
The uncertainty of temperature and concentration was calculated using the following formulae for uncertainty :
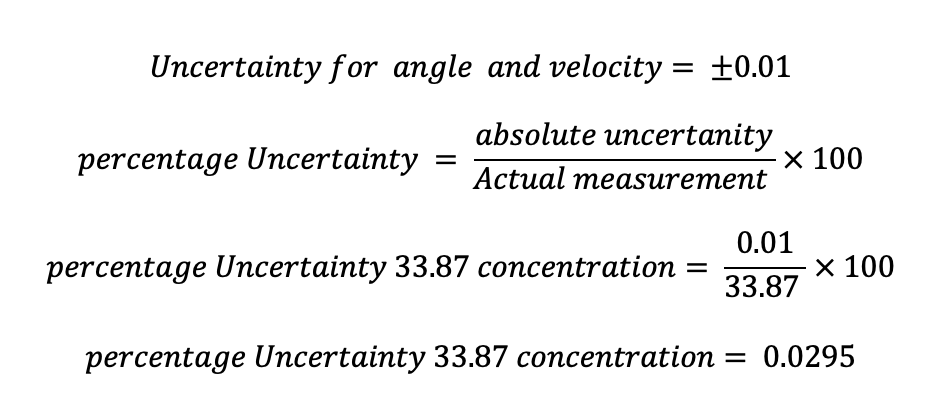
The above formulae were used to calculate the uncertainty for the rest of the temperature and concentration measurements and tabulated in table 5 below.
Table 5: The values of uncertainty generated
| Uncertainty of ± 0.01 | Uncertainty of contraction( ±0.01 |
| 0.05 | 0.029525 |
| 0.033333 | 0.028902 |
| 0.025 | 0.030451 |
| 0.02 | 0.026724 |
| 0.016667 | 0.026103 |
The values of uncertainty calculated in the above table are small, indicating precision in data collection and minimal random errors.
Conclusion
The investigation aimed to find out how an increase in temperature affects the concentration of aspirin. It was first hypothesized that an increase in the temperature would yield an increase in concentration. The data obtained from the experiments and graphical analysis showed that an escalation in the temperature of the aspirin resulted in an escalation in the concentration. The high value of regression constant 0.7873 obtained supported the investigation, which indicated that there is a strong relationship between the temperature and the concentration of aspirin. The values of uncertainty were very small, suggesting a high measure of accuracy in the data collection process. Therefore, an increase in temperature causes an increase in the concentration of aspirin.
Evaluation
The following table contains the sources of the strength of the investigation.
Table 2: Strength of the investigation
| Source of Strength | How it strengthed |
| Regression constant | The strong value of the regression constant of 0.7873 was one of the strengths of the investigation, which indicated a strong correlation between the two variables. |
| The high number of trails | The high number of trials increased the accuracy and reduced the level of uncertainty. |
| low uncertainty | The small values of uncertainty obtained suggest a high data accuracy level. |
| Methodology and procedure used. | The methodology used in the whole investigation assisted in the determination of changes between the independent and dependent variables. This led to the establishment of the relationship between the two measures. |
| The range of temperature of the aspirin solution was selected. | The temperature ranged from 0 to 60 degrees which increased the validity of the investigation. |
| Use of excel graphical software | The use of excel graphical software enhanced sufficient plotting of the data collected. |
The followings are the sources of errors and weaknesses that might have occurred during the experiments.
Table 3: Sources of errors and weakness
| Source of Error | Impact of the Error | Future Improvement |
| Loss of Heat
(Random error) |
Heat might have been lost during the heating of the aspirin solution, which might have reduced the accuracy of the temperature recorded. | Double-check the temperature readings before recording the final results to increase accuracy. |
| Approximation Errors
(Systematic error) |
The approximation of the values of trials might have reduced the accuracy of the investigation. | Ensure to use the same significant figures in the whole exploration |
| Stirring the solution
(Random error) |
Failure to stir the reactants of the water and aspirin solution might have reduced the accuracy of the rate of reaction recorded. | Ensure to stir the reactants before recording the temperature reading to ensure heat is evenly distributed within the solution. |
| Use of the beaker
(Random error) |
The use of a beaker might have resulted in contamination of the solution, which might have raised the boiling point of the aspirin solution and lowered its melting point. | One can adopt the use of a thermostatic |
The errors and limitations above in table 4 might have lowered the accuracy of the investigation and resulted in an increased percentage of uncertainty. Therefore, the finding and analysis of the data collected were able to support the hypothesis of the investigation. Hence, an increment in the temperature of aspirin causes an increment in the concentration of aspirin.
Extension and further experiments
This investigation can further be extended by checking the relationship between different temperatures and the concentration of other drugs, such as Tylenol. Tylenol is an alternative drug to aspirin which is widely used to reduce fever and relieve pain.
Works Cited
Rolnik, Daniel L., Kypros H. Nicolaides, and Liona C. Poon. “Prevention of preeclampsia with aspirin.” American journal of obstetrics and gynecology 226.2 (2022): S1108-S1119.
 write
write