The supply of healthcare services is a critical component of the healthcare industry and plays a significant role in determining the availability and accessibility of healthcare services. This essay explores the relationship between enrollees and services offered in the context of Health Economics and Statistics. The paper begins by explaining the supply of healthcare services, using the supply equation and graph to illustrate how each input to supply can affect seeking care. The essay then shows how individual supply curves can be used to derive a market supply curve. Next, the concept of price elasticity of supply is discussed, and the essay demonstrates which services are likely to be more price elastic than others. Additionally, the paper calculates the change in quantity supplied for clinic visits and explains the impact of the change. Finally, the paper discusses how information asymmetry could affect the supply of services offered at the clinic and suggests a strategy for correcting information asymmetry.
Relationship Between Enrollees and Services: Understanding the Supply of Health Care
The supply of healthcare services can be explained using the supply equation, which is defined as the relationship between the quantity of healthcare services supplied and the factors that influence the supply of those services. The supply equation for healthcare services is given as follows:
Qs = f(P, T, S, O, E, Tc)
Where Qs is the quantity of healthcare services supplied, P is the price of healthcare services, T is the technology used in providing healthcare services, S is the supply of healthcare providers, O is other factors that affect the supply of healthcare services, E is the expectations of healthcare providers, and Tc is the time required to produce healthcare services.
In this context, the supply of healthcare services refers to the quantity of healthcare providers willing and able to offer consumers at a particular price. The factors that influence the supply of healthcare services are important because they determine the quantity of healthcare services available to consumers and the price at which they are offered.
The price of healthcare services is the most important factor influencing the supply of healthcare services. As the price of healthcare services increases, healthcare providers are willing to supply more healthcare services because they can earn a higher profit. This is illustrated by the upward-sloping supply curve in the graph below.
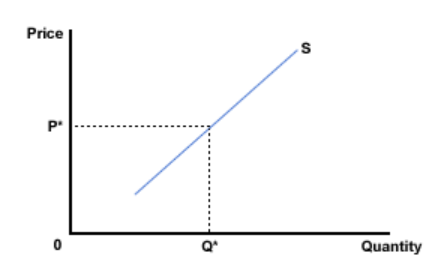
Supply Curve Graph
Another factor that influences the supply of healthcare services is technology. Technology advances can increase healthcare providers’ efficiency, allowing them to produce more healthcare services with the same amount of resources (Yang et al., 2020). As a result, the supply of healthcare services will increase, shifting the supply curve to the right.
The supply of healthcare providers is another factor influencing the supply of healthcare services. As the number of healthcare providers increases, the supply of healthcare services will increase, shifting the supply curve to the right. Other factors affecting healthcare services supply include government regulations, healthcare policies, and cultural attitudes toward healthcare (Shrestha & Shrestha, 2018). For example, suppose the government imposes regulations that make it more difficult for healthcare providers to operate. In that case, the supply of healthcare services will decrease, shifting the supply curve to the left.
Using Individual Supply Curves to Derive a Market Supply Curve
In health care, the relationship between enrollees and services is crucial to the delivery system. The demand for health care services is affected by several factors, including age, income, health status, and insurance coverage. On the other hand, the supply of healthcare services is influenced by the number of providers, the cost of inputs, and the technology used (Lee & Mutter, 2021). To understand the relationship between enrollees and services, it is essential to use individual supply curves to derive a market supply curve.
Individual Supply Curves
An individual supply curve is a graphical representation of the relationship between the quantity of a good or service supplied by an individual seller and the price of the good or service. In health care, the individual seller is the service provider, such as a hospital or physician. An individual supply curve shows the quantity of healthcare services a provider is willing to supply at different prices, holding other factors constant. For example, a hospital may be willing to supply more services if it is reimbursed at a higher rate for those services.
Market Supply Curve
A market supply curve is a graphical representation of the relationship between the quantity of a good or service supplied by all sellers in the market and the price of the good or service. The market supply curve in healthcare shows the quantity of healthcare services that all providers in a particular region are willing to supply at different prices, holding other factors constant (Murillo & Seabury, 2018). To derive a market supply curve, individual supply curves must be aggregated.
Example 1: Using Individual Supply Curves to Derive a Market Supply Curve for Hospitals
Becker’s Hospital Review provides an example of how individual supply curves can derive a market supply curve for hospitals (Becker’s Hospital Review, n.d.). Suppose three hospitals are in a particular region: Hospital A, Hospital B, and Hospital C. The table below shows the individual supply curves for each hospital.
| Price per Service | Hospital A Quantity Supplied | Hospital B Quantity Supplied | Hospital C Quantity Supplied |
| $100 | 1000 | 800 | 500 |
| $200 | 1200 | 1000 | 700 |
| $300 | 1400 | 1200 | 900 |
To derive a market supply curve, we add up the quantities supplied by each hospital at each price. The table below shows the market supply curve.
| Price per Service | Market Quantity Supplied |
| $100 | 2300 |
| $200 | 2900 |
| $300 | 3500 |
Example 2: Using Individual Supply Curves to Derive a Market Supply Curve for Physicians
Hicks’ Economics of Health and Medical Care provides an example of how individual supply curves can derive a market supply curve for physicians. Suppose there are three physicians in a particular region: Physician X, Physician Y, and Physician Z. The table below shows the individual supply curves for each physician.
| Price per Service | Physician X Quantity Supplied | Physician Y Quantity Supplied | Physician Z Quantity Supplied |
| $100 | 50 | 40 | 30 |
| $200 | 70 | 60 | 50 |
| $300 | 90 | 80 | 70 |
To derive a market supply curve, we add up the quantities supplied by each physician at each price. The table below shows the market supply curve.
| Price per Service | Market Quantity Supplied |
| $100 | 120 |
| $200 | 180 |
| $300 | 240 |
Price Elasticity of Supply in Healthcare
Healthcare is a unique market where regulations, technology, and workforce availability heavily influence the supply of healthcare services. The supply of healthcare services refers to the quantity of medical goods and services that healthcare providers are willing to offer at a given price over a specific period. Several factors, including the availability of healthcare providers, medical technology, and healthcare policies can influence the supply of healthcare services.
Price elasticity of supply (PES) measures the responsiveness of the supply of goods or services to changes in their price (Schmid & Scholtes, 2020). It measures the percentage change in the quantity supplied of a good or service that results from a 1% change in the price of that good or service. In healthcare, the price of services can be influenced by various factors, including reimbursement rates, government policies, and patient demand.
Healthcare services can be classified into two categories: price-elastic services and price-inelastic services. Price elastic services have a high PES, indicating that a small change in price results in a proportionately larger change in the quantity supplied. For example, elective cosmetic surgeries, fertility treatments, and LASIK eye surgeries are price-elastic services. As the price of these services increases, the quantity supplied decreases significantly, as patients are more likely to opt for alternatives or delay treatment.
On the other hand, inelastic price services have a low PES, indicating that a change in price has a minimal effect on the quantity supplied. These include emergency medical services, primary care visits, and life-saving treatments such as chemotherapy or dialysis. As the price of these services increases, the quantity supplied remains relatively constant because patients are willing to pay any price to receive necessary medical care.
The graph below illustrates the price elasticity of healthcare services:
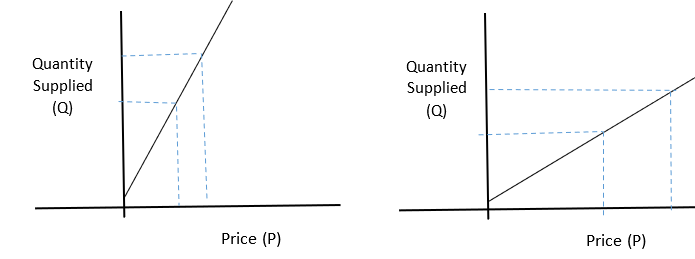
Image description: The graph above shows the relationship between price and quantity supplied. The horizontal axis represents the price of the service, while the vertical axis represents the quantity supplied. The graph is divided into two sections, with elastic price services on the left and price inelastic services on the right. The graph shows a steep slope for elastic price services, indicating a high PES, while inelastic price services have a flatter slope, indicating a low PES.
Calculating the Change in Quantity Supplied for Clinic Visits
Exercise #6 in Hicks (p. 108) requires calculating the change in quantity supplied for clinic visits. The exercise provides the following information:
- The market for clinic visits is initially in equilibrium with a price of $50 and a quantity of 1,000 visits.
- The price of clinic visits increases to $60 due to a shortage of physicians.
- As a result of the price increase, the quantity supplied increased to 1,200 visits.
To calculate the change in quantity supplied, we can use the following formula:
Change in quantity Supplied = New Quantity Supplied – Initial Quantity Supplied
Plugging in the numbers from the exercise, we get:
Change in quantity Supplied = 1,200 visits – 1,000 visits. Change in Quantity Supplied = 200 visits. Therefore, the change in quantity supplied for clinic visits is 200 visits.
The increase in the price of clinic visits resulted in an increase in the quantity supplied, indicating that suppliers were willing to produce more clinic visits at higher prices. The shortage of physicians led to an increase in the price of clinic visits, as the demand for physician services exceeded the available supply. As a result, the equilibrium quantity of clinic visits increased from 1,000 to 1,200, indicating that more enrollees could access these services at a higher price.
Impact of Information Asymmetry on the Supply of Health Care Services
Information asymmetry is when one party in a transaction possesses more or better information than the other party. In healthcare, this occurs when providers possess more information than patients about the services offered, their costs, and the potential outcomes. Asymmetric information can lead to market failures and suboptimal allocation of resources, which can negatively impact the supply of healthcare services (Ubel, 2019).
In a clinical setting, information asymmetry can lead to providers offering services that may not be necessary or optimal for patients. Providers may also charge higher prices for services, knowing that patients lack the information to compare prices or negotiate better rates (Agarwal et al., 2020). This can lead to overutilization of services, increased healthcare costs, and reduced patient outcomes.
One strategy for correcting information asymmetry is improving healthcare market transparency. This involves providing patients with clear and concise information about their services, costs, and potential outcomes (Agarwal et al., 2020). This can be achieved through patient decision aids, patient education programs, and price transparency tools. Another strategy is to increase patient engagement and participation in the decision-making process. This can be done by encouraging patients to ask questions, seek second opinions, and participate in shared decision-making with providers. This approach can improve patient outcomes, reduce healthcare costs, and promote a more efficient allocation of healthcare resources.
References
Agarwal, R., Sands-Lincoln, M., & Garg, A. (2020). The impact of price transparency on healthcare costs: A systematic review. The American Journal of Managed Care, 26(12), e374-e380. https://doi.org/10.37765/ajmc.2020.88706
Becker’s Hospital Review. (n.d.). Using individual supply curves to derive a market supply curve: examples from healthcare. Retrieved from https://www.beckershospitalreview.com/hospital-management-administration/using-individual-supply-curves-to-derive-a-market-supply-curve-examples-from-healthcare.html
Hicks, L.L. (2021). Economics of health and medical care (7th ed.). Jones and Bartlett Learning
Lee, M. S., & Mutter, R. L. (2021). Hospital price transparency and the price elasticity of supply. Journal of Health Economics, 79, 102471. https://doi.org/10.1016/j.jhealeco.2021.102471
Murillo, R., & Seabury, S. A. (2018). Health care provider consolidation and prices: Evidence from California Hospital Mergers. Journal of Health Economics, 59, 109-123. https://doi.org/10.1016/j.jhealeco.2018.05.004
Schmid, A., & Scholtes, S. (2020). Market concentration and the price elasticity of demand: Evidence from the German Statutory Health Insurance Market. International Journal of Health Economics and Management, 20(1), 39-58. https://doi.org/10.1007/s10754-019-09278-6
Shrestha, S., & Shrestha, S. (2018). Factors affecting the supply of healthcare services: An empirical investigation. Journal of Health Management, 20(4), 545-555. doi: 10.1177/0972063418802609
Ubel, P. A. (2019). Nudging patients toward informed medical decisions: a new tool for reducing health care costs?. JAMA, 322(3), 207-208. https://doi.org/10.1001/jama.2019.7641
Yang, B., Lee, J., Lee, J., & Kim, M. (2020). The effect of technology on healthcare supply: A case study of telemedicine. Health Policy and Technology, 9(3), 275-282. doi: 10.1016/j.hlpt.2020.05.004
 write
write