1.0 Introduction
Choy (2020) described Google Merchandise Store as an online store run by Google selling Google-branded merchandise. Besides, Google Merchandise Store sells merchandise or goods coming from other Google brands like YouTube and Android. According to Emma (2018), Google Merchandise Store was established on 11 March 2015 selling various lifestyle products, clothing, and stationery worldwide. This paper will give a quantitative analysis of the Google Merchandise Store Website’s digital performance utilizing various instruments and digital theoretical techniques. To meet this, the report will provide a well-detailed argument on the web accessibility and User experience assessment, analysis of social listening and state of media engagement as well as analysis of social media sentiments or comments in the Fashion/Merchandise industry. Moreover, the report will incorporate a detailed assessment of data collected from the Google Merchandise Store’s analytic account applied in assessing the operation state of the store taking a strategic digital marketing standpoint. Besides, the report provides recommendations to Google Merchandise Store on improving fashion/merchandise sales in the future.
2.0 Comparison of Accessibility and User Experience or UX Analysis of Two Players in Fashion/Merchandise Industry with Google Merchandise Store
2.1 Apple Store
Bernd (2020) stated that there are particular User experiences or UX interface values that can be applied in optimizing the user experience and maximizing adaptations. The Apple Store comprises of retail stores chain retained and run by Apple Inc. Apple stores engage in selling various Apple products inclusive of iPhone smartphones, Mac personal computers, iPad tablet computers, Apple TV digital media players, Apple Watch Smartwatches, software, as well as Apple-branded and various selected third-party accessories (Bernd, 2020). Apple Inc is a software giant that utilizes branding strategies like a concise copy, neutral colors, and others in providing users with a plane experience while on the firm website. Apple has excellently provided users with a unified experience when using the Apple Store website via the use of design strategies such as the F pattern, white space, concise copy among other techniques. Some of the ways Apple Store designs its website take into mind user experience (Perri, 2018).
One of the designs is highlighted as “less is more, especially on the homepage.” In this case, Perri (2018) argued that it turns out to be easier for the website users to become overwhelmed especially where there is much-taking place on the website. Flashy design techniques such as slideshows, pop-ups, and the animated intro screen have the likeliness of causing a distraction to the real crux of the site, thus driving away from the users before starting a search for what they require. Apple’s website stands by the maxim, “Keep it simple, silly” (Perri, 2018). After one enters the website and sees the homepage, they receive greetings with white space and simple, visually pleasing imageries. After approaching the website, the eyes of the users are attracted to the first image which is the new iPhone X that is hyperlinked to the informational page and presents the user the option of purchasing the product (Bernd, 2020).
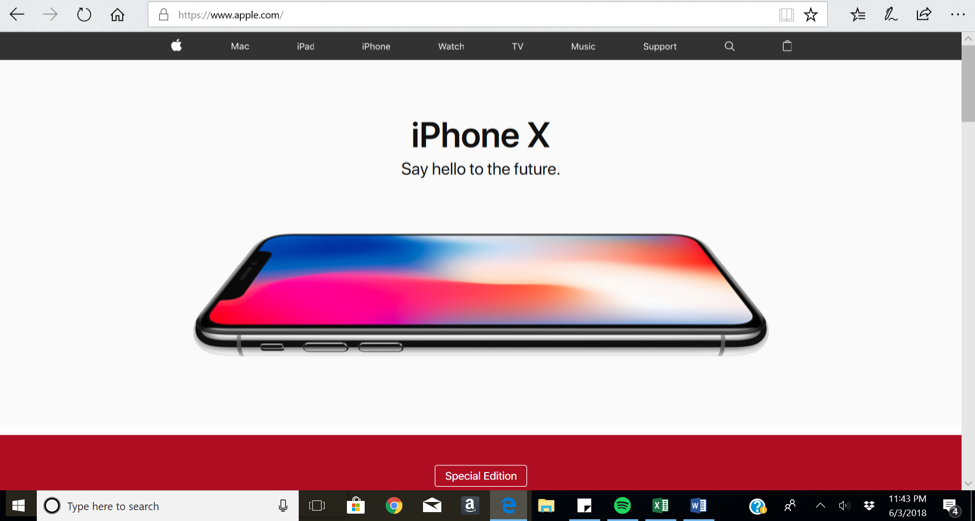
Figure 1 showing the homepage of the Apple Store Website
Source: Perri (2018).
Besides, at the Apple Store homepage, the user can find the navigation menu that directs one to the desired support section or product. Rather than having various navigation layers before users reach their desired products, Apple Website has provided the user with a menu having the exact thing they want, an indication it prioritise functionality and does away with middlemen (Perri, 2018).
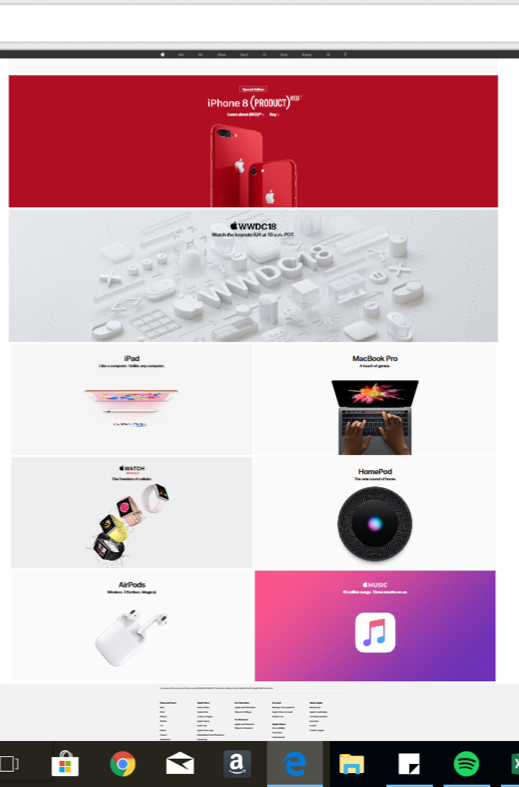
Figure 2 showing the Apple Website navigation menu
Source: Perri (2018).
After users scroll further on the Apple homepage, they come across concise copy integrated with a few images introducing the most popular or new products. Users are redirected to find the information they require to enable extra discovery with no information overload(Perri, 2018). With the simplified design, users are allowed to have the capacity of navigating the website easily while lowering the bouncing rate, thus increasing users’ likeliness of making purchases.
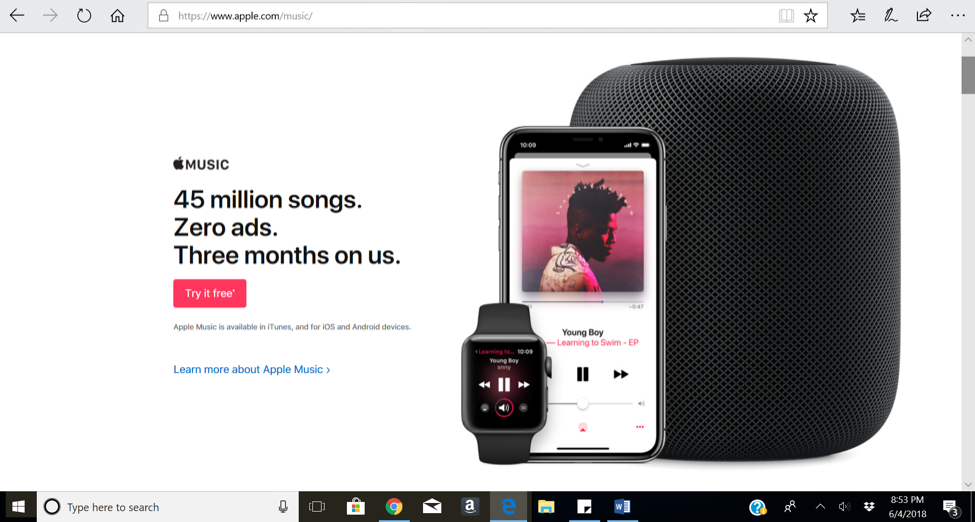
Figure 3 showing Apple page details of a new product or most demanded product
Source: Perri (2018).
Another core feature about Apple Website design is the “F Pattern layouts and varied font sizes that maximise on scan-ability” (Perri, 2018). The Apple website has been designed in line with the F-Pattern which helps the users in skimming the web content. The feature has the name “F” which is an indication that it encourages the viewers to read the content either scanning horizontally, scanning vertically, learning more on the subsequent sections, and continuing reading down the left side vertically (Shirley, 2020).
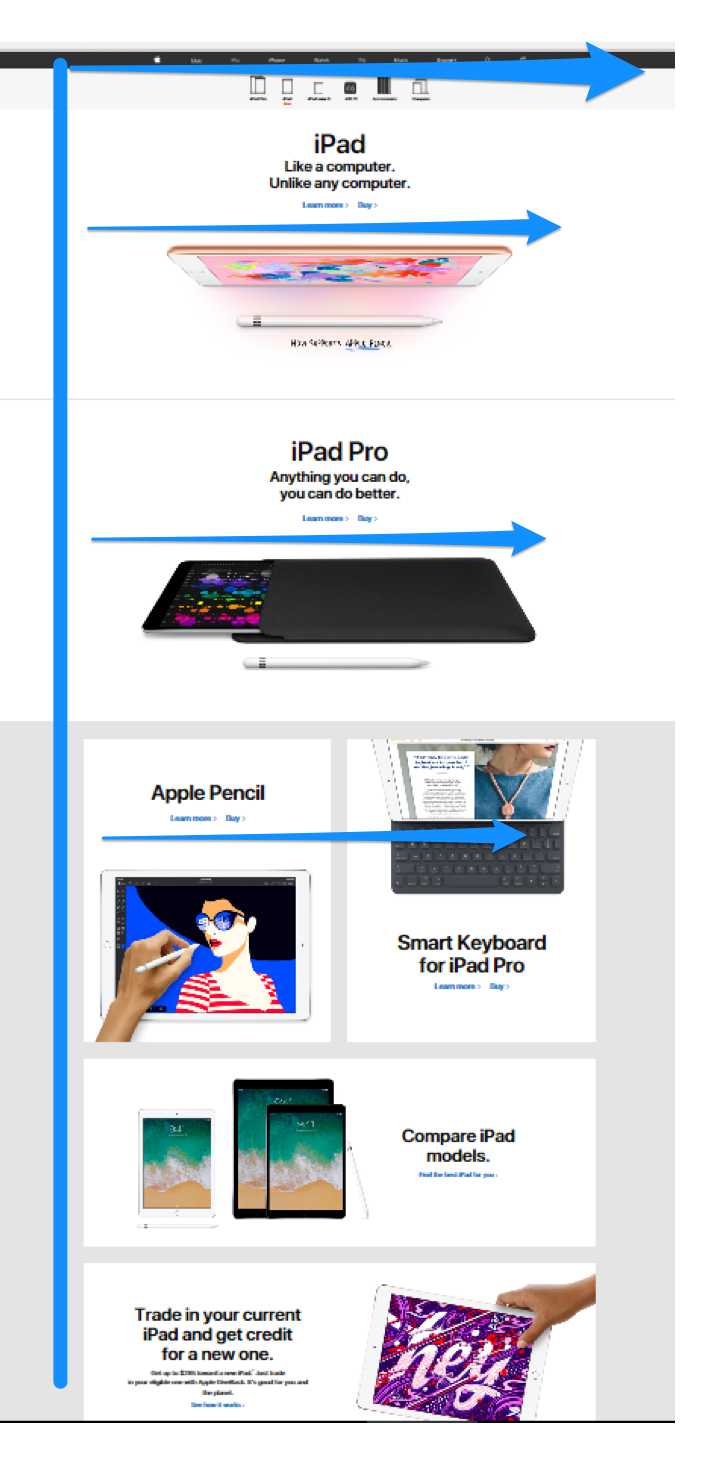
Figure 4 showing different ways Apple website user can read the web content
Source: Perri (2018).
In the case of Apple’s website, the use of the F-pattern has helped in accomplishing various things. Ganotra (2020) noted that most of the Apple web users tend to start reading from the top left corner, where the Apple logo is found for establishing brand identity. In addition, the navigation bar is placed at the top of the screen all through as well as on the product pages whereas the second navigation bar provides a list of products in their respective category (Perri, 2018).
The other significant feature about the Apple website regards to “responsive design that increases the conversion rates whereas decreasing bouncing rates”(Perri, 2018). Apple has been able to maintain the design integrity of its website UI consistently all-over various devices. Besides, Apple has been diligent by maintaining a fast page load time which provides users with a seamless experience.

Figure 5 taken from iPhone 6 where user finds where to learn about iMac Pro and making direct purchases from the website
Source: Perri (2018).
2.2 Amazon Prime
According toAriella (2020),Amazon Prime is a predictable, usable, and expected platform with psychological reasons to why users are addicted to shopping like convenience and anonymity. One core design of the Amazon Prime website is easier learnability which regards the aspect of visibility and feedback. Amazon Prime has well-implemented elements that well communicate activity to the platform users in a simple manner.
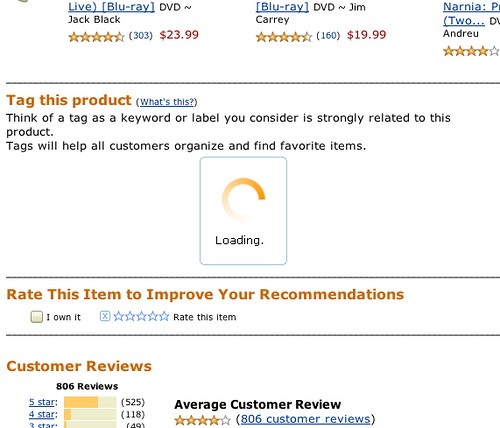
Figure showing the aspect of Amazon Prime learnability
Source: Ariella (2020).
Ariella (2020) provided a mapping example applied in the application, especially where the user has the capacity of controlling the scrubber bar via moving the finger right or left for easier rewinding or forwarding parts of the track.
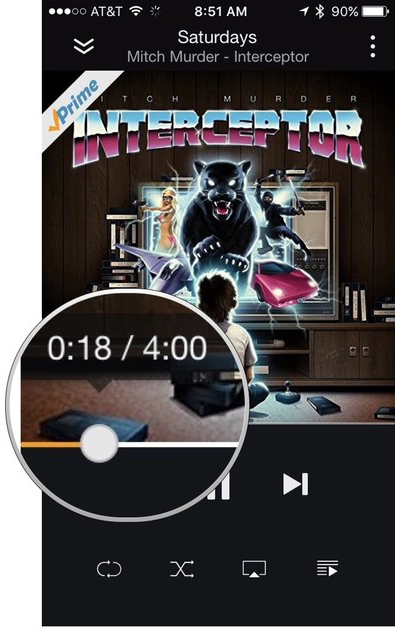
Figure showing a mapping example in the user application
Source: Ariella (2020).
Ariella (2020) highlighted the aspect of affordance which has been won by Amazon. An example of this is the website design offering the “add to cart” and the ill-reputed “buy it now” buttons. In this case, these buttons have been slightly raised to allow the platform users to understand that they need to be pressed like a button as it could be for a non-digital product.

Figure showing the affordance aspect of Amazon Prime website
Source: Ariella (2020).
Another aspect is memorability, which from the product page, the website visual design has designed principles and elements creating and enhancing streamlines memorable flow. Actions, objects, and options are available which allows the shoppers to effortlessly circumnavigate their ways while shopping (Ariella, 2020). Besides, the platform provides satisfaction to users which is enhanced through simple surveys to the customer regularly. The simple survey helps in measuring the user’s satisfaction level which has enhanced communication with customers, thus improving user loyalty and improved retention.
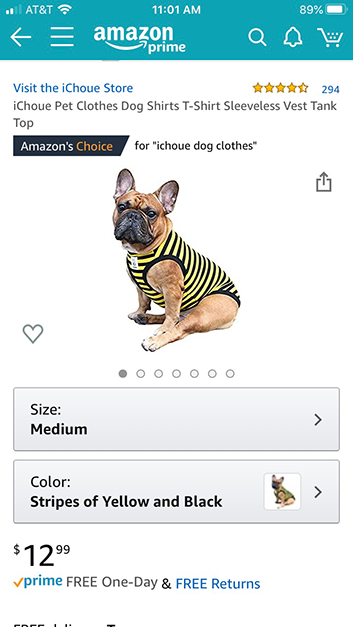
Figure showing Amazon Prime product page
Source: Ariella (2020).
Another crucial website design that has enhanced user experience is inclusion. According to Ariella (2020),Amazon has a vision of becoming the Earth’s most customer-centric firm, and the firm has worked hard to ensure there are easier ways for disabled customers to enjoy everything offered by Amazon across firm services, devices, and more. The page is considered as the gateway for accessibility feature with the ability to improve the Amazon experience. Besides, Ariella (2020) indicated that the Amazon website tends to be accessible while the firm has extended efforts to enhance the shopping experience for visually impaired users. Ariella (2020) highlighted that the Amazon Prime app is screen-reader friendly following the adoption of other accessible features like voice search option, instant alerts, one-button access, and direct links for Amazon callbacks.
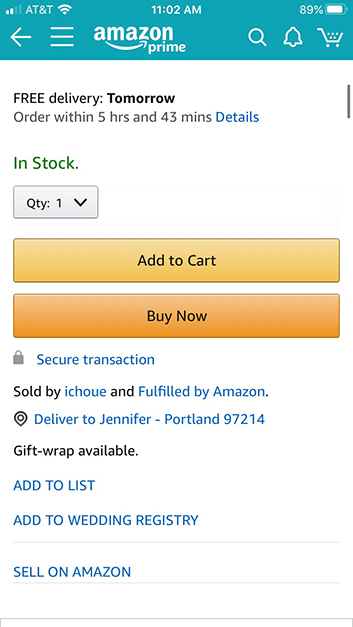
Figure showing Amazon Prime homepage
Source: Ariella (2020).
3.0 Social Listening and the State of Social Media Engagement in the Industry
Social media according to Clark (2020) has been an extension of various brands and an excellent place for brands to experience growth and leverage community power. Several brands in the merchandise and retail industry have used social media platforms in attracting customers and increasing revenue. In the industry, social media has been a crucial driver of online sale growth. Besides, social media has emerged as an essential part of the merchandise retailing businesses since it provided access to a vast audience base and exceptional engagement levels (Clark, 2020). However, for some of the merchandise retail business, social media has become complicated since several brands have engaged in active competition for a spot in the user feeds. Clark (2020) stated that 90% of the merchandise firms have demonstrated that marketing via social media has helped in increasing their business exposure. Despite this, retail merchandise firms are preferring walk-in customers in brick-and-mortar stores.
Various measures are used in collecting data. Some of the metrics are relevant hashtags, brand mentions, industry trends, and competitor mentions (Garrett, 2010). Clark (2020) noted that social media for the retail and merchandise businesses allows listening to the customer base and learning more about the customers. Such can be leveraged by replying to the customers and making the best out of the conversations on social media. The conversations are assessed and demonstrated through social listening to give an insight into the prospect’s personality interests, traits, and challenges.
4.0 Analysis of Social Media Comments in the Industry
Social media listening has helped firms in the industry to have a better understanding of what their audience desires from the brand. For instance, a customer can tweet detailing how they love a particular product (Clark, 2020). In addition, a company can come across a conversation where the customer could be in search of solutions offered by a firm product or service. In the merchandise and retail industry, Zappos can be taken as an example since it is well known for its legendary customer services as well as consistency in social engagement with fans.
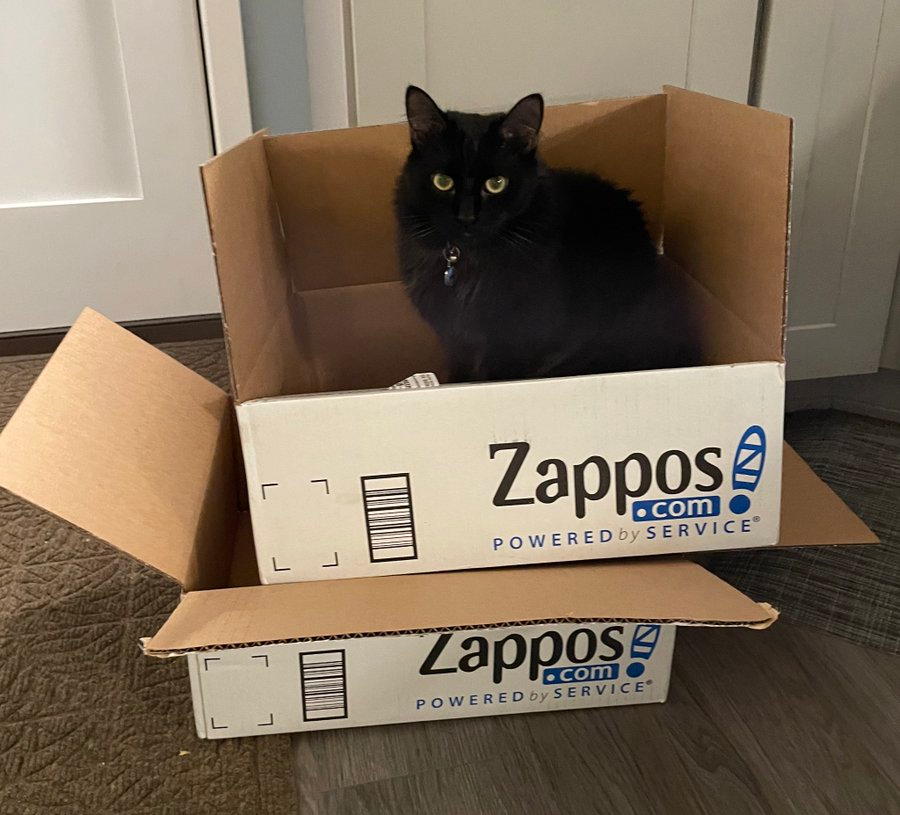
Figure showing a tweet by a customer about Zappos
Source: Newberry (2021).
Moreover, Zappos has been keeping an eye out for conversations especially where users give recommendation for the form as an alternative shoe shopping platform. The firm tends respond using positive comments or additional recommendations. Newberry (2021) argued that social listening has to do with insights on what customers highlight about a brand or product. In addition, it is about what people say about rivals and the industry. Such gives an essential understanding of the marketplace. A conversation can demonstrated a gap in the market which a firm can take advantage off. Discovery of the new opportunities and threats helps in planning and responding in real-time (Clark, 2020).
In addition, customer feedback as stated by Newberry (2021), are guide resources for the business growth. Through active collection of customer feedback, merchandise retailers are informed on the needs of their audience. Customer stories need to be explored via online interviews on social media. Customer feedback are at the heart of social media especially in the merchandise and retail business (Clark, 2020). Ability to reach out the customers individuals will help in opening up a conversation which should start through open-ended questions. For example, Imprint Products is a gifts and clothing brand with capacity of putting their customer reviews on the brand Instagram page. In every review, the firm ensures it tag the product on the customer giving the review which ease potential customers shopping from the Instagram.
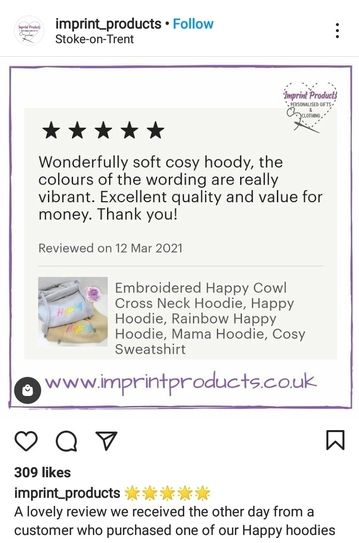
Source: Newberry (2021).
5.0 Analysis of Google Merchandise Store Data
Digital Analytics Measurement model or DAMM can be used in analysing Google Merchandise Store Data. Using the DAMM model, the firm website and business objectives can be elaborated in converting them to measurable metrics. The metrics vibrate with the final managerial objectives of the firm and have the ability to objectively assess the efficiency of Google Merchandise’s digital performances. In addition, coming up with the model enhances the digital tool to stay relevant and accurate over time. From the table below, there is a detailed description of the model citing three different areas of Digital Marketing. All through the analysis, a steady solution has been developed for the achievements’ possibilities.
| DAMM for Google Merchandise Store | |||
| DAMM Steps | Acquisitions | Behavior | Conversions |
| Business Objectives | Understanding customer desires and preferences and aligning firm value proposition. | Providing the final customer experience for stimulating customer loyalty and increasing Customer Lifetime Value or CLV. | Increasing sales level and maximization of the firm margins |
| Website Goals | Driving relevant and efficient traffic to the firm website | Improving customer satisfaction and visitors purchase experience | Make the e-commerce platform as user friendly and effective as possible |
| KPIs | Cost per acquisition
Number of visits |
Page depth
Customer retention |
Average order value
Conversion rate |
| Targets | Increasing number of user visits of 30%
Reducing CPA of 2% |
Increasing repeat visits of 25%
60% of page depth >1 |
Increasing conversion rate of 3%
Increasing the average order value by 25% |
| Segments | Paid Traffic
Referral Traffic |
Page depth
Returning visitors |
Payable search purchasers and non-purchasers |
On the other hand, Google Analytics Implementation Audit is a tool applied in revealing the significance and functionality of particular measurement metrical for assigning the overall score to the website digital tracking apparatuses. Taking consideration of the Google Merchandise Store, some of the key metrics used in tracking relates to forming completion tracking and transaction tracking. In this case, the transactions tracking is related to the purchases made whereas the form completion tracking relates to the eCommerce forms that are filled at the checkout procedure. It remains crucial for the firm to have an understanding of the products purchased by the customers from the store and determine the process part customers halt or leave unfulfilled. Presently, the aspect of tracking the transactions has been functioning efficiently whereas there is not sufficient visibility from the user end on the way the form completion is deep in tracking works in determining the conclusive score for the tracker.
Besides, some other crucial metrics relate to goal setup, account setup & governance, funnel setup, Adwords and campaign tracking, event tracking, product brand tracking, and site search tracking. For the firm website, tracking of campaigns, Adwords, the funnel, and site quests tend to work as described. As a result of the simplistic aspect of the campaigns, data hardness tends not to be optimized but fails at tracking the issue moderately campaign issues. Apart from the issue, the trackers tend to work as projected and do not demonstrate any issues.
For the case of goal arrangement, event tracking, and product brand tracking, there exist core improvements that must be set out. Since the firm has the interest of opening up to reach a wider audience, goals must be established comprising more details to attain clear segmentation of the audience and highlighted the desired audience. Event and product brand tracking are active despite various entries being under the “not set” container thus rendering monitoring relatively upsetting mainly for the new viewers. In the case of account arrangement and ascendency, the nature of the Google ecosystem website, controlling the score and status for the tracker tends not to be exclusively founded on the merchandise store, thus there are no regulated weight and score allocated.
Finally, the resolute “nice-to-have” metrics are used for tracking error page tracking and code deployment tracking. The website has previously used tracking codes for various instances like the foundation of traffic, merchandise observing behaviors, and trailing for opinions of withdrawn or inaccessible pages. Nonetheless, organized tracking codes can be reentered for the avoidance of irregularities and inconsistencies in reporting.
Going down to Google Analytics data, four core perceptive pieces of information need to be enhanced, addressed, or transformed. In the website Dashboard, some graphic representation demonstrated relevant data that has been further investigated in Key Insight Analysis.
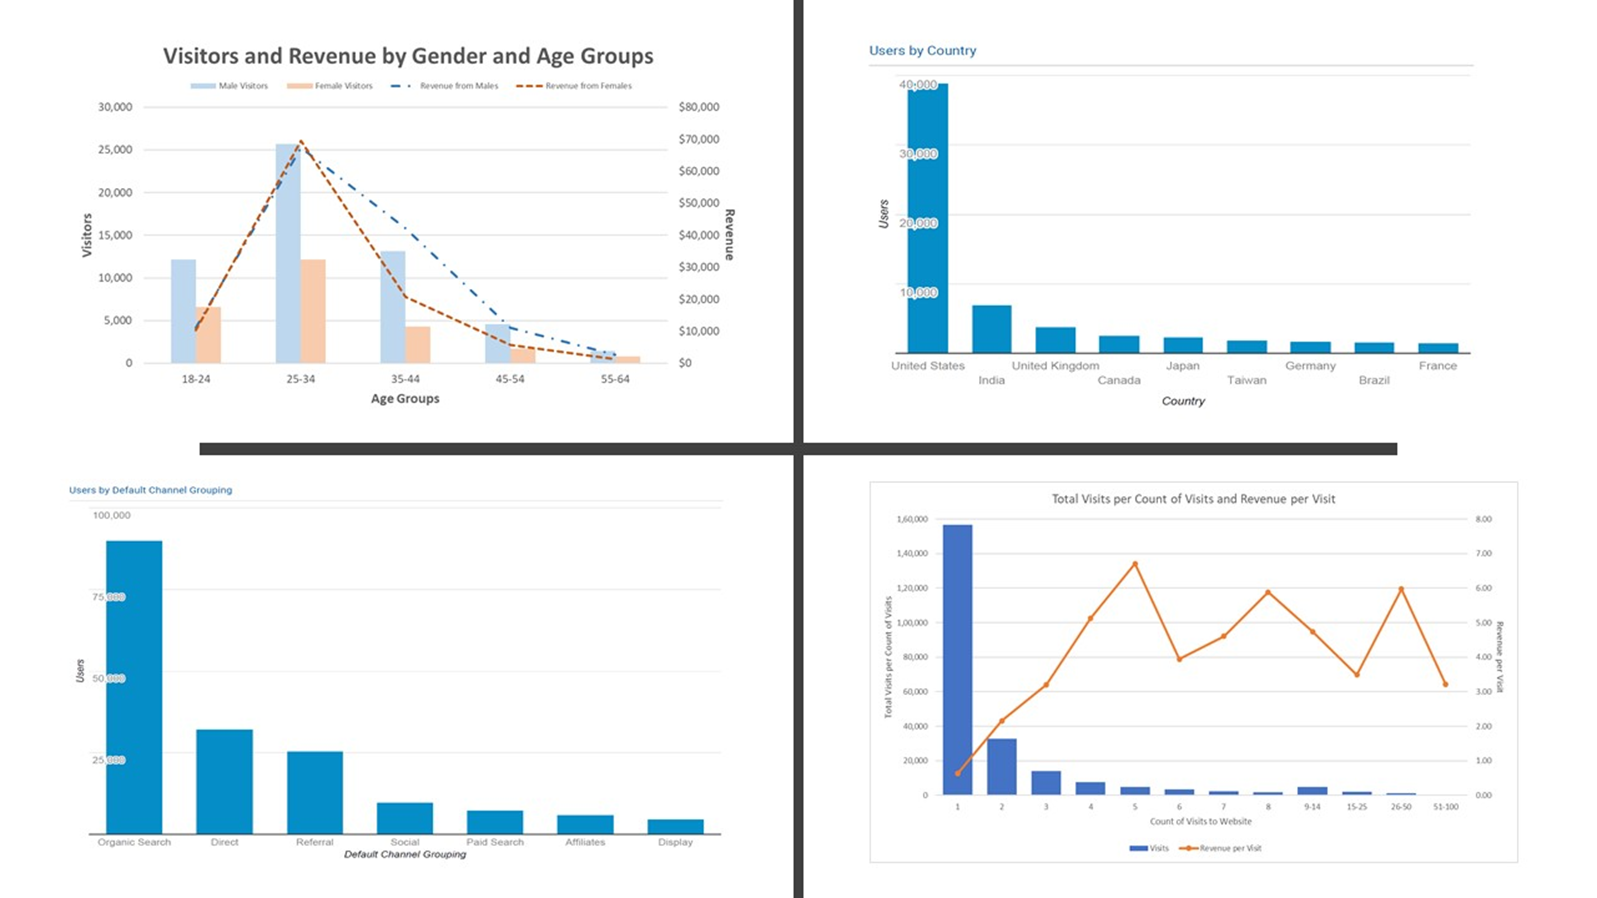
Figure showing Google Merchandise Store Dashboard
5.1 Insight on Target Market Personification
|
Objective: Target Market Personification |
||
|
Precedence Level: High |
||
 |
||
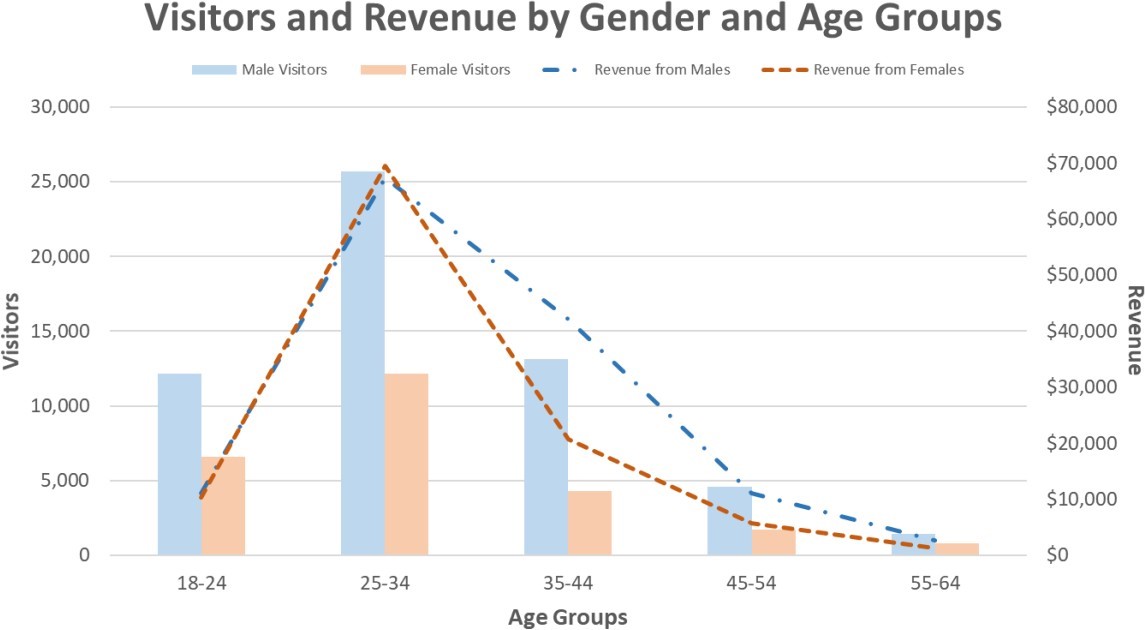
| Some of the Key Trends and Insights:
The number of men visitors surpass the number of women in all the age groups The revenue from the male visitors is demonstrated to be high than that of female visitors There are similar revenue levels excluding the age group of 34-44 years Audiences aged between 25 to 34 years represent the largest group followed by audiences aged between 18 and 24 and those aged between 35 and 44 years. |
||
| Impact:
The method used to visit the website greatly depends on the technology that is regularly used by audiences aged between 25 and 34. The design and method used to connect with and user experience reflects the age bracket of 24 and 34 years. The merchandise provided tends to meet men’s demands, desires, and interests. Actions: Redirecting the campaigns and aligning them with 25 to 35 age brackets The goal is to increase the count of male visitors aged between 25 to 34 years Target, in this case, is increasing the number of male visitors aged between 25 to 34 years by 10 percent (this will be from 25,000 to 27,000) within three months. The method relates to the A/B Test; A relates to Current Website Design whereas; B relates to Male aged between 25 to 34 years of age, with key interest focusing on the item as highpoint (largely the technology, media, and entertainment). The supposition being precise high-pointed item pitched in the direction of the strongest demographic calls for 25 to 34 male users by increasing it by 5 percent. A/B Testing: Website being Home Page Update The goal is keeping or ensuring visitors bounce back or return from the home page |
||
Key Understanding: From the insight, it is evident that the majority of the visitors are men aged between 25 and 34 years and have an interest in the section of technology, entertainment, and media.
The goal, in this case, is to open the Website to the general public, thus the need to understand the present audience which can help in building the core target customer of the Google Merchandise Store. Thus, it remains essential to get prepared for future advertising determinations and Website development in line with the key audience.
Individuals aged between 24 and 34 years comprise the most audience visiting the firm website. As noted, the audience is associated with the most revenue for the firm’s website. Thus, the strategies and methods used to connect with the age group need to be accustomed accordingly. This incorporates the ads applied on different platforms, websites, and website designs.
Part of the recommendation act regards the need for Google Merchandise Store to indicate items that are of interest to the audience aged between 25 and 34 years, particularly the male segment of the age group. In this age group, the determined items are technology, entertainment, and media types which are greatest searched thus giving the sense of being demonstrated.
5.2 Insight on Count of Visits per Demographics
|
Objective: Shift count of visits from 1 to 2 – 5 |
|
Priority Level: Medium |
Key Trends & Insights: From the analysis, most of the website visits 67.42% was from the audience viewing the website once within 3 months. At least 25 percent of the visits were from users making a return to the website for 2 times to 5 times Revenue for every visit increased while more visits were being made Revenue per visit was only $0.63 Revenue growth per visit maximized at the fifth visit by the user at $6.71 every visit. Six or more visits demonstrated a varied revenue and visitor numbers were very small. |
| Impact:
Extra visits past the first visit could lead to a potential gain in the revenue Revenue at the first visit started at $0.63 Maximum revenue growth per visit is $6.08, which is at the fifth visits Minimum revenue growth every visit is $1.53 at the second visits In addition, 48.8% of the total revenue was from visitors who returned to the website at least 2 to 5 times. Visitors who viewed the site at least two to five times accounted for 25.57% of the visits. Revenue coming from the segment was half of the total revenue. Revenue accounted for visits that surpass five visitors remain high than one visit but it is challenging to forecast as a result of fluctuation. |
| Actions:
Target increasing the points of links, especially for the advertisements and the target audience as well as other payable and non-payable efforts. The goal, in this case, is changing the count of visits per visitor from the first to second to fifth visits. The target is to increase 30 percent of the total visits within twelve months. To attain this, the method to use is introducing advertisement on Google platforms such as Waze, Google Playstore, YouTube, among others. |
Key Understanding: People visiting the website more than one held higher revenue per visit
From the insight, it can be noted that the majority of the Website visitors only visited once and contributed 67.42 percent of the total visits. The other proportion of 32.58% of visits is associated with visitors coming to the website at least more than one time. This can be broken down to demonstrate that 25 percent of the visits were from viewers who made a return to the website at least two to five times, thus representing the treasured part of the audience.
Besides, it can be noted that the number of one-time visitors was several than the case of repeated visitors. However, on average, visitors making more views spent almost $1.53 and could go to $6.71 per view. Besides, the top number of visits was in the range of two to five since most of the visits beyond this demonstrated a declining revenue per view.
On the part of recommended action, the Google Merchandise Store needs to consider increasing points of contact or links between advertisements and target audience together with other payable and non-payable efforts. The objective of the effort is to ensure the visitors make more returns to the firm website or make at least more than one visit from the initial view. Google Merchandise Store needs to increase the total number of visits from two to five repeat users to almost 30 percent in the next twelve months. Such can be met by the introduction of advertisement campaigns mostly on Google Platforms like Waze, YouTube, and the Google Playstore.
6.0 Conclusion
In the report, the Google Merchandise store’s digital performance has been demonstrated. Using the Digital Analytics Measurement model, for aligning Google Merchandise Store with the firm purposes and having awareness of the successful measures. Besides, things have been narrowed down by focusing on the firm website functionalities as well as the digital tracking tools via coming up with the Implementation Audit. Also, data on visits and marketing acquisitions was explored which has helped in finding useful insights for the firm management. In addition, the insights were directed on establishing inventive, treasured, and quantifiable optimization or growth arrangements in core categories of audience demographics, paid campaigns, and traffic networks.
References:
Garrett, J. J. (2010). Elements of user experience, the: user-centered design for the web and beyond. Pearson Education.
Emma, A.W., (2018 March). The Ultimate Guide to Google Analytics for UX Designers. [Online] Retrieved from: https://uxdesign.cc/google-analytics-ux-alice-emma-walker-958d6f0f0af3
Perri, J, (2018 June). 4 Website UX Design Takeaways We Can All Learn from Apple. [Online] Retrieved from: http://marketing.sfgate.com/blog/4-website-ux-design-takeaways-we-can-all-learn-from-apple
Bernd, B, (2020 May). 8 Things I Learned Analysing Apples Product Pages. [Online] Retrieved from: https://uxplanet.org/8-things-i-learned-analyzing-apples-product-pages-9a5284681b37
Shirley, E, (2020 June). How Apple Created the World Best e-commerce Experience During Covid-19. [Online] Retrieved from: https://www.linkedin.com/pulse/how-apple-created-worlds-best-e-commerce-experience-during-shirley/
Ganotra, K, (2020 August). Redesigning the Apple Music Experience- A UX Case Study. [Online] Retrieved from: https://uxdesign.cc/ui-ux-case-study-apple-music-redesign-46ff1f433363
Ariella, G., (2020, Sept). Usability, Accessibility, and Ethics- Amazon Prime. [Online] Retrieved from: https://uxmag.com/articles/usability-accessibility-and-ethics-amazon-prime
Choy, D, (2020 Oct). Web Analytics on Google Online Merch Store. [Online] Retrieved from: https://nycdatascience.com/blog/student-works/googlin-merch-data-analysis-of-google-merchandise-store/
Clark, S., (2020 October). What Can Social Listening Do to Improve CX? [Online] Retrieved from: https://www.cmswire.com/customer-experience/what-can-social-listening-do-to-improve-cx/
Newberry, C., (2021 November). What is Social Listening, why it Matters, and 10 Tools to Make it Easier. [Online] Retrieved from: https://blog.hootsuite.com/social-listening-business/
 write
write