Abstract
With the globalization of the world’s economy, every nation appears to be following a clear trend of making direct investments in foreign entities. People must pay attention to the economic differences and foreign direct investment (FDI) differences between different regions while paying attention to the growth of the overall national economic aggregate and considering whether such economic growth and economic change are appropriate. The growth and change of FDI, which can reflect the degree of economic openness, are not the same in different regions.The quantity of FDI in the United States has increased by more than twofold during the last two decades. In US dollars, the amount of FDI was 1.26 trillion, but by 2021, it will have climbed to over 5 trillion (Canes-Wrone et al., 2020). FDI refers to financial investments made by a corporation in one nation into a company or other entity in another. For U.S. FDI, the direct foreign investment made by businesses or other organizations in the country is what is displayed. Although the United States gets a sizable amount of FDI each year, it also invests a much larger amount in the businesses or other entities of other nations. The United States has invested over $890 billion USD in 2020 in the United Kingdom as well as another $843.95 billion USD in the Netherlands (Statista, 2017).
According to Kuznets’ definition, “economic growth” is the continuous expansion of a nation’s or region’s capacity to offer its citizens an expanding range of economic goods (Hsieh et al., 2019). This capacity for long-term, sustainable growth should be based on advanced technology and the corresponding institutional reorganization (Li & Fabu, 2019). According to Kaldor, these are common facts about economic growth: Production per person continues to rise, and the rate of growth does not tend to slow; continuous long-term expansion in per-person physical capital; output of physical capital is nearly constant; capital return is nearly constant; the proportion of labor and physical capital in national revenue is essentially consistent;Different nations and areas have different rates of growth in terms of production per person (Kaldor, 1957).
Introduction
FDI, or foreign direct investment, is a significant driver of economic expansion. Both the immediate and indirect routes are involved in the FDI-growth relationship. Multinational companies (MNEs) directly increase production capacity in host nations and hire local labor, which boosts jobs and revenue. By transferring cutting-edge production technologies, management nomic expansion. Both the immediate and indirect routes are involved in the FDI-growth relationship. Multinational companies (MNEs) directly increase production capacity in host nations and hire local labor, which boosts jobs and revenue. By transferring cutting-edge production technologies, management know-how, and working habits to local businesses, MNE activity can indirectly boost the productivity of those industries. Global value chains (GVCs) have greatly expanded as a result of foreign direct investments, and MNEs have played a key role in coordinating GVCs through their networks of international affiliates and non-equity modal partners.
For policymakers, future FDI patterns are essential data, especially in developing economies where economic prospects are frequently correlated with inflows of foreign productive capital (Wang & Jiayu, 2019). The Sustainable Development Goals (SDGs; UNCTAD, 2014) must be achieved through external financing that is continuous and sustainable, especially FDI. With fewer than ten years until the SDGs’ target and the world currently experiencing an unprecedented health and economic crisis with potentially disastrous repercussions for international capital flows, it is especially crucial to have accurate techniques for forecasting future FDI trends (Li & Fabu, 2019). Although there is a lengthy history of forecasting macroeconomic variables like the gross domestic product (GDP) and rising prices, the forecasting of FDI is still practically incomplete.
Literature Review
This section gives background information on the subject and discusses any applicable theories, models, and background data, as well as the theoretical implications of the topic. It also acts as the study’s textual framework.According to Hsieh et al. (2019), in the case of the United Kingdom, recent foreign direct investment inflows have fluctuated over time, and it is necessary that foreign direct investment be maintained indefinitely or possibly even show a rising pattern in order to have a significant impact on an economy by positively influencing some important macroeconomic fundamental concepts. According to Wang & Jiayu (2019), the United Kingdom’s net foreign direct investment in 2008 was almost half of what was claimed or documented in 2007 (Canes-Wrone et al., 2020). The amount of foreign capital inflows disclosed in 2008 totaled £85.80 billion, which was $73.3 billion less than the amount reported in 2007 (£159.10 billion). Nigeria is the continent’s largest economy, with a share of FDI entering the continent that averages approximately 9.9%, down from 24.19% in 1990 to 5.87% in 2001 and up to 11.66% in 2002, as per UNCTAD (2009).
Conceptual Review
Either directly or indirectly, foreign direct investment benefits the home or host nation. The host economy is impacted by foreign direct investment in a variety of ways, including asset, capital, and technology inflows as well as the development of employment options. The indirect effect pertains to a rise in secondary good and service demand that aids in opening up an economy for additional financial and technological resources as well as the need for more labor (Li & Fabu, 2019). If the host nation does not make strategic policy arrangements, the advantages of foreign direct investment might not even generally emerge (Canes-Wrone et al., 2020). Foreign direct investment inflows can be important in fostering employment opportunities, reducing poverty, accelerating development and growth, boosting savings, fostering foreign business by joining the global economy, and fostering the transfer of modern technology, provided the host nation creates a favorable business environment for foreign investment. FDI inflows show significant volatility, especially since the 2000s. The predominantly inflow-driven structure is highly volatile, whereas FDI into developing economies exhibits far more steady characteristics (Li & Fabu, 2019). Large swings in the volume of ICLs, global trends in M&As, which are closely correlated with capital markets, and huge swings in fundamental influence to (or rather through) conduit countries (offshore financial centers, or OFCs), are the main causes of large fluctuations and cyclical movements in total FDI flows.
Theoretical Literature Review
According to Hsieh et al. (2019), the Hecksher-Ohlin model and the product life cycle theory are taken into consideration in this study since they are theories that can be used to explain the existence of foreign direct investment. According to the Hecksher-Ohlin model, nations will trade with other countries that use up their scarce resources and export goods that use up their surplus supplies or production inputs. According to the product lifecycle, a product goes through the following four developmental stages: I. The stage of innovation II. The launch phase In the innovative stage and take-off stage, the company will start producing for the home or local market, stages III and IV (Canes-Wrone et al., 2020). According to Wang & Jiayu (2019), the decline stage is V. In the maturity stage, as the company’s product appears to expand, the company will begin exporting the product to foreign markets or starting exports to other countries. In the decline stage, which is the final stage, some competing businesses begin producing the goods and then begin exporting and selling them to other regions of the world as well as to the innovative firms already present in the domestic market (Li & Fabu, 2019). According to this paradigm, foreign direct investment shifts from industrialized nations to emerging economies, and the reverse is also true.
Empirical Literature Review
With data ranging from 1982 to 2017, Adamu (2018) predicted foreign direct investment inflows from the USA to Nigeria over just a 10-year period, considering net foreign direct investment influx as a parameter (Canes-Wrone et al., 2020). The Exponential Smoothing (EST) algorithms are the forecasting method employed in the study. The analysis finds that over the projected years, there would be a moderate but positive increase in the amount of foreign direct investment coming into Nigeria from the United States, with a growth rate ranging from 2.1% to 3.0%. Thabani and Wallingon (2019) applied a time series of annual data for net foreign direct investment from 1960 to 2017 to forecast the net foreign direct investment in Nigeria.
Econometric Modeling
An in-depth explanation of the econometric model utilized is provided in this section. Additionally, it will describe how the model is used and how the analysis is done. The findings and results will also be discussed in light of this particular instance.
Four variable vector autoregressive (VAR) models
To determine if the gender dynamics of the LFPR and UR connection are heterogeneous across ages, a four-variable vector autoregressive (VAR) model established by Bernstein and Martinez (2021) is assessed using data that is gender- and age-disaggregated. In a combined, four-variable VAR model, Bernstein and Martinez employ the same CPS data to model U.S. LFPR and UR data that have been gender-disaggregated (Li & Fabuš, 2019). They concentrate on January 1980 to December 2019 for their analysis because of the relative constancy seen between male and female UR and LFPR over this time (Choi et al., 2021). The lengthy, one-to-one link between the male and female LFPR, the static male UR vector, and the static female UR vector are the three co-integrating relationships that the authors find evidence of among the four variables (Canes-Wrone et al., 2020). Just the female UR and LFPR endogenously respond to disequilibrium in this long-run connection for both the LFPR gap and stationary female UR vectors. Only the female LFPR is marginally endogenous for the static male UR vector.
According to Choi et al. (2021), there is evidence of heterogeneity, and unique VAR models with four variables are created for each age group. There are two types of long-term relationships for people in the 16–24 age range: a UR gap and an LFPR gap. Three long-term male partnerships between the ages of 25 and 54 are noted as an LFPR gap. The statistics are monthly annualized LFPR and UR CPS data. The LFPR represents the percentage of civilian, non-institutionalized people who are employed or looking for work.According to Wang & Jiayu (2019), the percentage of the labor force that is unemployed is represented by the UR. The analysis focuses on LFPR and UR statistics that have been broken down by age and gender. The data range from January 1948 to January 2022; however, to improve comparability with the findings of Bernstein and Martinez, the accompanying research will concentrate on the period from January 1, 1980, to December 31, 2019.
Yellowknife’s model
According to Hsieh et al. (2019), the Yellowknife model is centered on simulating food price inflation in the Northwest Territories’ city of Yellowknife. Considering the low rate of inflation in the nation as a whole, it is unexpected that there are high food costs in Canada’s provinces. Following the discovery of the high cost of food in the North and West Territories, a number of economic theory-based hypotheses were created to account for the high rate of inflation in food prices in the territory (Li & Fabuš, 2019). The first two assumptions can be conceptualized using a common supply-and-demand microeconomic model. One way to think about the third hypothesis established is to use a common macroeconomic model of aggregate demand and supply. According to Wang & Jiayu (2019), first, it is predicted that there is a direct correlation between Yellowknife’s oil price and the inflation rate in food prices. This was postulated because food shipments, which frequently originate from neighboring Canadian provinces, must travel great distances in order to reach the territories.
According to Choi et al. (2021), it is projected that the price of food products will be positively influenced by the price of crude oil because the cost of shipping is directly affected by the oil prices and transportation costs are an input cost in the food’s price (Li & Fabuš, 2019). Therefore, in a typical microeconomic model of supply and demand, the comparatively high transportation costs related to food reaching Yellowknife can be conceptualized as a leftward shift in the supply curve, pushing up price.
Model
The time series model
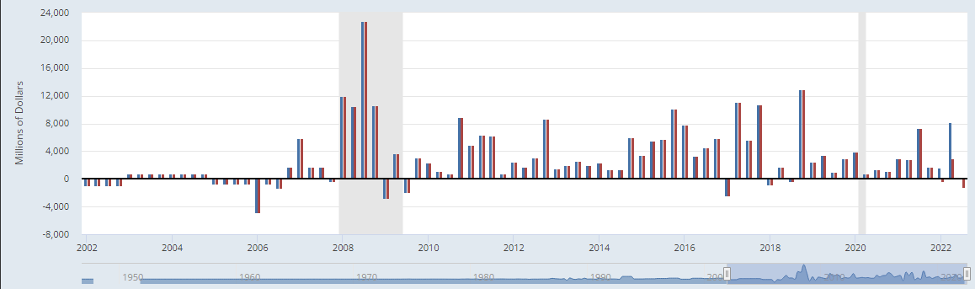
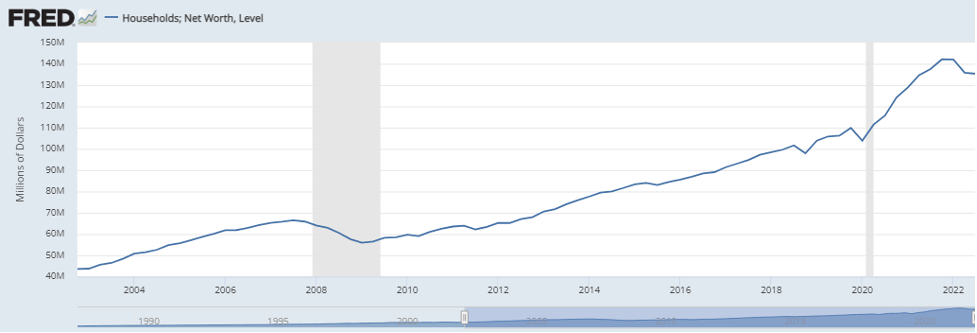
The section examines foreign direct investment (FDI) between the years of 2002 and 2022 which was extracted from the FRED. In order to investigate the direction of causality and long-term link between the variables foreign direct investment (FDI), Victoria Tribon’s four variable vector autoregressive (VAR) models, as well as the Yellowknife’s model, have been implemented. The study spans the years 2002 to 2022. After the strong analysis of the data from FRED with the use of ox metrics software, the below data were obtained.
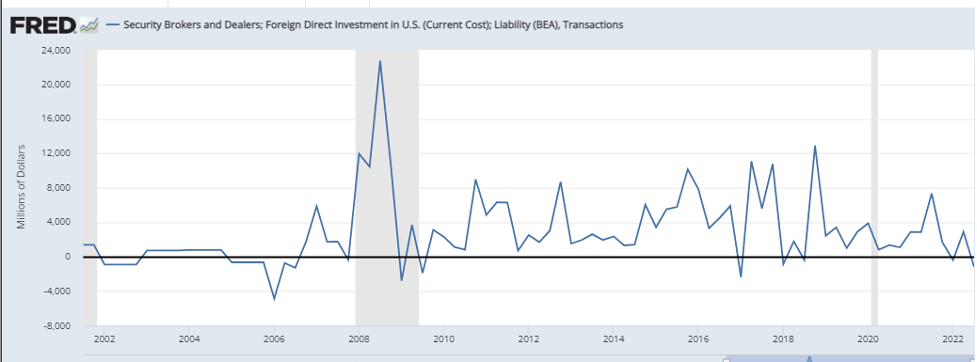
Using the time series model, FDI inflows show significant volatility, especially since the 2000s. The predominantly inflow-driven structure is highly volatile, whereas FDI to developing economies exhibits far more steady characteristics (Choi et al., (2021). Huge swings in the quantity of ICLs, global trends in M&As, which are closely correlated with financial markets, and large swings in investment flows to (or rather through) conduit countries (offshore financial centres, or OFCs) are the main causes of wide variations and cyclical movement patterns in total FDI flows.Using global to represent current global FDI inflows and the subset that includes inflows to OFCs.
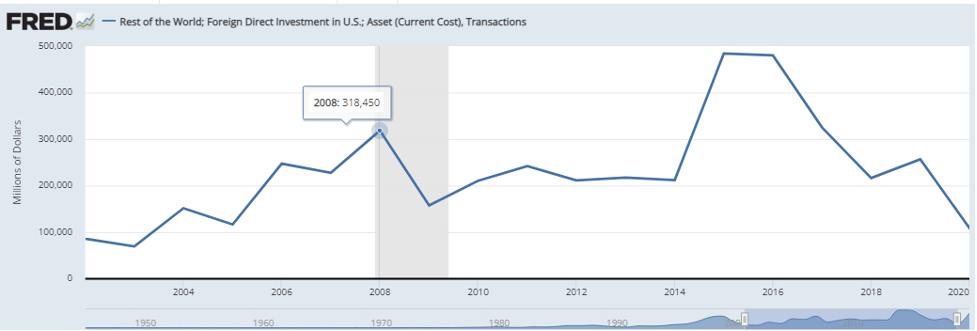
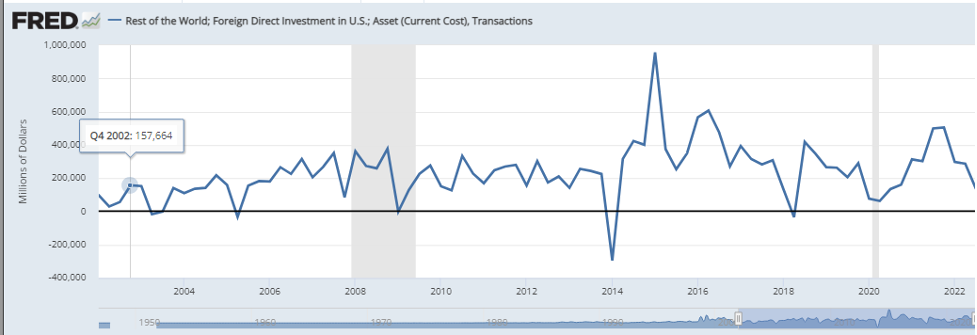
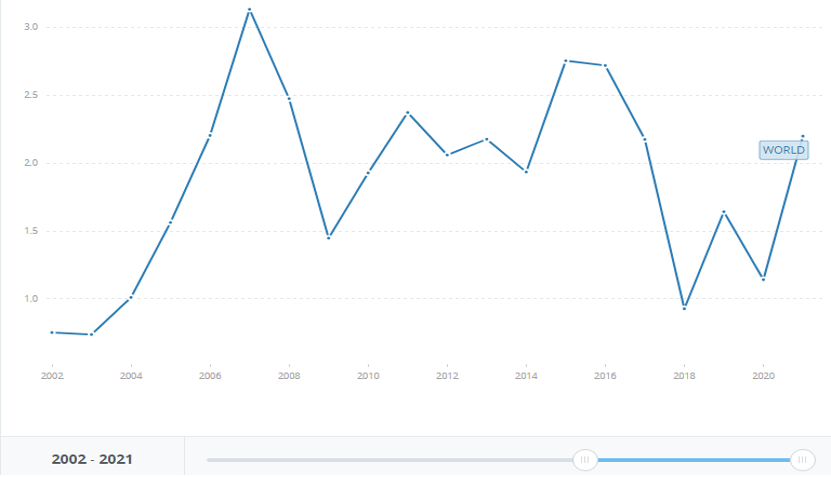
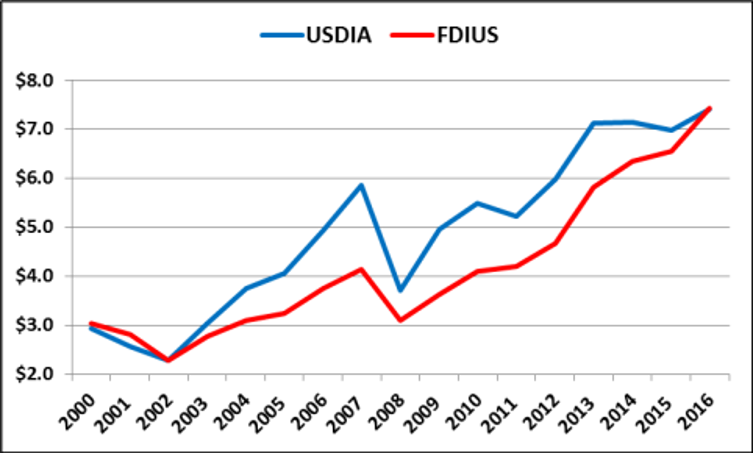
Graphs 1 and 2 show the data obtained about the rest of the world: foreign direct investment in US: Asset (current cost), transactions. A variety of additional elements are involved, such as the way FDI regulations are put into practice. Other factors, such as governmental ownership in important sectors, might also result in entry obstacles. The capacity of a nation to draw foreign direct investment will depend on a variety of elements, including the size of its market, the degree of integration with its neighbors, and even geography. However, FDI regulations have a significant role in determining a nation’s allure to international investors. In contrast to geography, FDI regulations are a matter within government control. FDI limitations typically occur in primary industries like mining, fishing, and agriculture, but they can also occur in the media and the transportation sector.
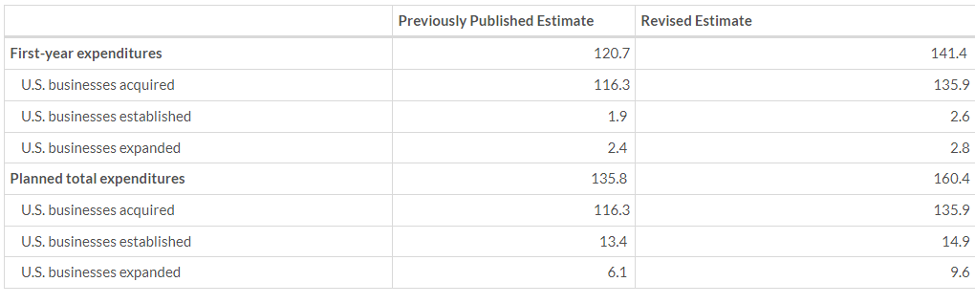
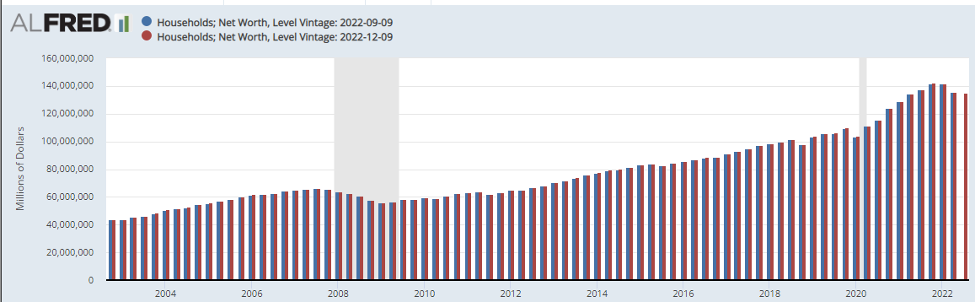
From the table 1 and 2 above, a large portion of the growth occurred in the first quarter, since global FDI flows decreased by 22% in Q2 2022 compared to Q1 2022. Considering rising interest rates, inflation, and energy costs, as well as Russia’s all-out invasion of Ukraine, this decline is not unexpected. Globally, the United States received the most FDI. The Victoria Tribon’s four variable vector autoregressive (VAR) models, as well as the Yellowknife model, must be used by choosing any of its three auxiliary models in order to determine the sequence of integration of the annual time series (with trend and intercept, with intercept, and without trend or intercept). The null hypothesis expresses the presence of a unit root in the sequence, and the hypothesis test will take into account comparing the -statistic with any corresponding critical values of the Dickey-Fuller distribution. According to Hsieh et al., (2019), the auxiliary models can be rectified for the occurrence of a higher-order autocorrelation of inconsistencies by choosing the best lag in accordance with the Akaike (AIC), Schwarz Bayesian (SIC), and Hannan-Quinn (HQ) information criteria.
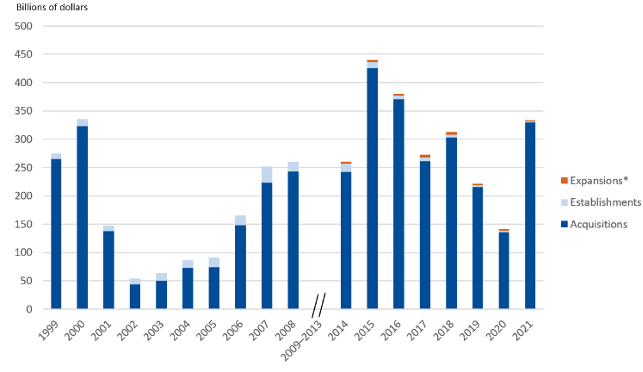
In the above graph, the fDi Report 2021 offers a fascinating look at the shifting global landscape via the lens of foreign direct investment (FDI). The paper describes the characteristics of the new investment cycle depending on the in-house fDi Markets database, which is the most comprehensive service in the world for tracking and analyzing cross-border greenfield investment.
Conclusion
The worldwide inward foreign direct investment stance in the United States, or the total amount, was estimated to be roughly $6.4 trillion in 2016 by the United Nations1, with the estimated global total inward direct investment stance being approximately $26.7 trillion. With inbound direct investment positions roughly one-fourth or less of those of the United States, Hong Kong, China, the United Kingdom, Canada, and the Netherlands are the nations with the next-largest overall inbound investment positions after the United States. Manufacturing accounted for the majority of new direct investment spending, totaling $121.3 billion, or 36.4 percent of all spending, by industry. Chemical manufacturing saw the most spending ($63.2 billion) while computers and electronic devices saw the highest ($30.2 billion) in manufacturing. The real estate, renting, and leasing sector saw significant spending as well (43.8 billion).
References
Canes-Wrone, B., Mattioli, L., & Meunier, S. (2020). Foreign direct investment screening and congressional backlash politics in the United States. The British Journal of Politics and International Relations, 22(4), 666-678.
Choi, S., Furceri, D., & Yoon, C. (2021). Policy uncertainty and foreign direct investment. Review of International Economics, 29(2), 195-227.
Hsieh, H. C., Boarelli, S., & Vu, T. H. C. (2019). The effects of economic policy uncertainty on outward foreign direct investment. International Review of Economics & Finance, 64, 377-392.
Li, S., & Fabuš, M. (2019). Study on the spatial distribution of China’s Outward Foreign Direct Investment in EU and its influencing factors. Entrepreneurship and Sustainability Issues, 6(3), 1280.
Nagao, S., Takeda, F., & Tanaka, R. (2019). Nowcasting of the US unemployment rate using Google Trends. Finance Research Letters, 30, 103-109.
Wang, C., & Jiayu, C. (2019). Analyzing on the impact mechanism of foreign direct investment (FDI) to energy consumption. Energy Procedia, 159, 515-520.
Yavas, B. F., & Malladi, R. K. (2020). Foreign direct investment and financial markets influences: Results from the United States. The North American Journal of Economics and Finance, 53, 101182.
Zafar, M. W., Zaidi, S. A. H., Khan, N. R., Mirza, F. M., Hou, F., & Kirmani, S. A. A. (2019). The impact of natural resources, human capital, and foreign direct investment on the ecological footprint: the case of the United States. Resources Policy, 63, 101428.
Appendices
 write
write