Executive Summary
Ratio analysis has been one of the many options for analyzing the performance of companies. Every single investor will be interested in monitoring the potential of each unit of investment made. Using the financial statements, the report calculated eight ratios in the three standard categories profitability, liquidity, and efficiency. The results generally indicated that Next Plc. was having a healthy performance throughout the investigation—all ratios were within the recommended rates. However, the trend analysis showed that the company was strangling across all the ratios in the second year 2021 as compared to 2020. The study concluded that there was a necessity for Next management to take measures that will help them improve profitability like extensive marketing campaigns, cutting operating costs, and improving their sales. Efforts to strengthen Next Plc. efficiency required policy adjustments regarding the receivables days.
Introduction
In finance, so many analysis approaches have been employed to give an understanding of a company’s performance. Among other methods, qualitative techniques such as SWOT analysis, PESTEL analysis, and BCG analysis have been used. However, quantitative analysis approaches give a better deal and understanding of business performance. On this note, the current report evaluated the quantitative situation of Next Plc. through the ratio analysis. Ratios offer an experience of the business performance by making a comparison of the business against its past years, against its peers, or even against its established budgeted performance (Attrill & McLaney, 2010).
The objective of the study
This report aims to evaluate the performance of Next Plc. in the years 2020 and 2021 through the computation and presentation of ratios in the profitability, liquidity, and efficiency areas. The report will communicate the score of the Next Plc. Against the recommended rates and present a recommendation to investors based on the results. In total, eight ratios were analyzed in the three categories based on their importance to investors.
Research Methodology
The study was a quantitative research design that offers much of its value by analyzing numbers behind the financial statements and presenting such numbers in the form of ratios, rates, percentages, or days for easy comparative analysis. The report performed a horizontal analysis comparing entities’ performance over several years (Haralayya, 2021). Therefore, ratios for 2020 and 2021 were obtained and analyzed as discussed in the section below. Financial ratios for the two years were obtained from Next Plc. (2021) as published by the company.
Ratios Analysis
Ratios analysis has been a widely used analysis approach in finance and management. Ratios provide a uniform unit of measure that compares businesses with others, even if they are not using the same currency or even tracking a company’s performance as it graduates the different levels of business growth.
Profitability ratio
Perhaps the most important ratio that investors would be interested in. Profitability ratios offer a picture of how a company can generate profits for the shareholders from different dimensions (Hasanaj & Kuqi, 2019). A company that scores well in the profitability ratios will attract more investors than a company performing well in any other ratio. The report evaluated the return on capital employed (ROCE), net profit ratio, and gross profit ratio, as presented below.
Return on Capital Employed
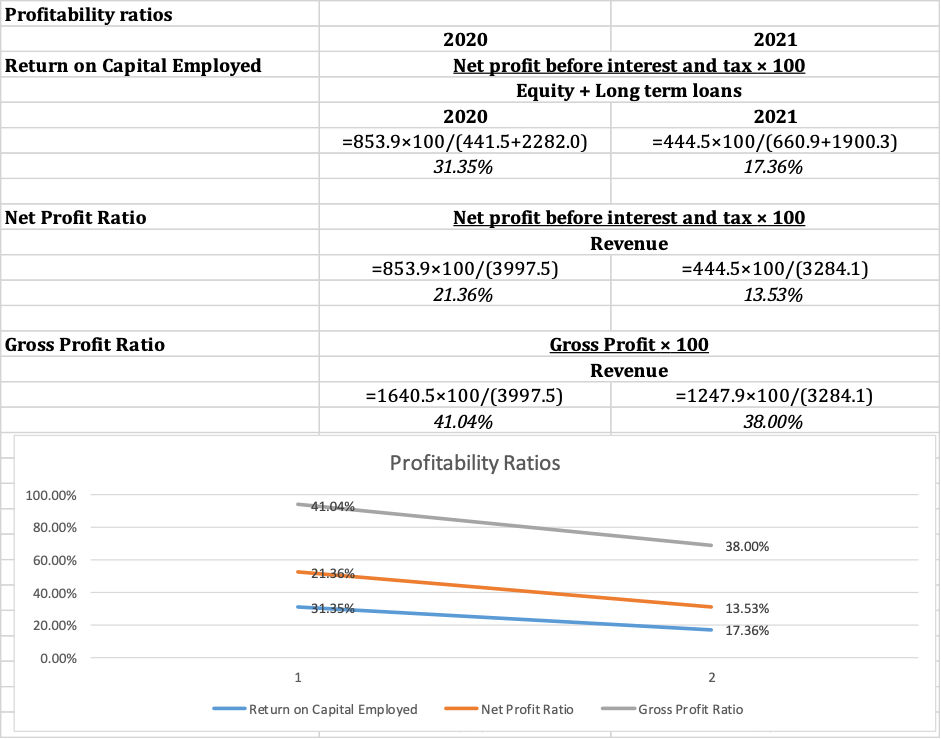
ROCE evaluates the profits a business generates relative to the long-term investments made by the company. The ratio assesses the earning before interest and tax against capital and long-term liability. Ayuba, Bambale, Ibrahim, and Sulaiman (2019) indicated that a higher value would be desirable, but a value above 20% will be acceptable. Next Plc. recorded 31.35% in the year 2020 and a rate of 17.36% in the year 2021. Thus, the company had a good performance in 2020, but a decline of 14% that fell below the recommended rate was an indicator of poor performance in 2021.
Net Profit Ratio
The ratio evaluates the ability of the business to generate profits from the revenue earned. A good performance indicates that the company translates more of its sales into net profit before interest and tax. In their study, Shad, Lai, Fatt, Klemeš, and Bokhari (2019) pointed out a higher value ranging between 10% and 20% would be desirable. Next Plc. reported a rate of 21.36% in 2020, and recorded a 7.83% decline in 2021 to 13.53%. Again, this indicates poor performance in the second year of analysis, almost falling below the bare minimum level.
Gross Profit Ratio
The gross profit ratio evaluates the rate at which the firm retains its revenue into gross profit. In other words, the ratio assesses the sales margin after adjusting the sales cost. A desirable rate between 50% and 70% have been preferred. Next Plc. recorded a value of 41.04% in 2020 and 38.00% in 2021.
From the profitability ratios above, the trend in the appendix indicates that all three ratios gave a declining performance in 2021. The performance of the business could be affected by the pandemic across the globe.
Liquidity Ratio
The category of ratios here evaluates the ability of a company to repay its due liability using its current assets. A healthy business will be able to cover up its current liabilities with current assets more than two times (Husna & Satria, 2019).
Current Ratio
The ratio evaluates the number of times the current assets cover the current liabilities. Meeting the current obligations more than two times is desirable. For Next Plc. a score of 2.1:1 and 1.9:1 in 2020 and 2021, respectively. The rate is within the recommended range for 2020, but a decline in 2021 indicates declining performance.
Acid Test Ratio
The ratio advances the diligence used in the current ratio by recognizing that inventory is a slow-moving asset. The ratio is expected to be slightly below the current ratio rates. Next Plc. Their performance during the review years recorded rates of 1.50:1 and 1:46 in 2020 and 2021, respectively. The strength of the business is noted to have declined in 2021.
From the liquidity ratios, the performance of Next Plc. seems to have been good in 2020 but declined slightly in 2021 for both ratios. The performance needs to be boosted by reducing the current liabilities through a positive policy on timely repayment.
Efficiency Ratios
Efficiency ratios assess the ability of the management of a company to use the resources at their disposal in the best way possible. Most of the ratios in this category are policy-based.
Inventory days ratios
The ratio evaluates, on average, the number of days the business will take to convert inventory into sales. The rate or number of days is highly influenced by the industry and nature of products offered. Next Plc. recorded values of 75 days and 88 days for the inventory.
Tradepayablesdays
The ratio evaluates on average, the number of days it will take the business to repay their goods supplied on credit. The rate has it is the norm of most industries to use 90 days repayment period. Next Plc. recorded a value of 84 days in 2020 and 94 days in the year 2021. The rates for the two years seem to be within the recommended rates but with an increasing day in the second year.
Trade receivable days
The ratio assesses the number of days it will take a business on average to collect the trade receivable apon supplying goods on credit. Although a higher rate may attract debtors and increase sales, the rate of 90 days has been recommended. Next Plc. reported a value of 120 days in 2020 and 135 days in 2021 indicating longer than recommended rate and with a worsening trend.
Conclusion
In conclusion, the performance of Next Plc. has been noted to be fairly good in 2020 for all ratios considered except for trade receivables days. However, 2021 seems to be a downfall for the business across all the ratios considered with a declining trend being an indicator of strained performance. The report makes a recommendation to the managers to employ marketing strategies that can compel customer loyalty in the market for better performance in the profitability ratios. Managers should also make strategies to cut on cost of operations in an attempt to boost performance. Policies in relation to trade receivables should be reviewed to work with the recommended 90 days period.
References
Attrill, P. and McLaney, E., 2010. Finance and Accounting for Non-Specialists.
Ayuba, H., Bambale, A.J.A., Ibrahim, M.A. and Sulaiman, S.A., 2019. Effects of Financial Performance, Capital Structure and Firm Size on Firms’ Value of Insurance Companies in Nigeria. Journal of Finance, Accounting & Management, 10(1).
Haralayya, B., 2021. Financial statement analysis of shri ram city union finance. Iconic Research And Engineering Journals, 4(12), pp.183-196.
Hasanaj, P. and Kuqi, B., 2019. Analysis of financial statements. Humanities and Social Science Research, 2(2), pp.p17-p17.
Next Plc., 2022. Next Plc. Annual Reports and Accounts for 2021. Available [Online] From <https://www.nextplc.co.uk/~/media/Files/N/Next-PLC-V2/documents/2021/annual-report-and-accounts-jan21.pdf> Accessed on 17 March 2023.
Shad, M.K., Lai, F.W., Fatt, C.L., Klemeš, J.J. and Bokhari, A., 2019. Integrating sustainability reporting into enterprise risk management and its relationship with business performance: A conceptual framework. Journal of Cleaner production, 208, pp.415-425.
Appendix: Next Plc. Ratios Results


 write
write