Part 1. Ratios Calculation.
In this assignment, 2020 and 2021 were chosen for the analysis. Therefore, the ratios calculated and analyzed are based on the financial statements for BGC Ltd for 2020 and 2021, respectively.
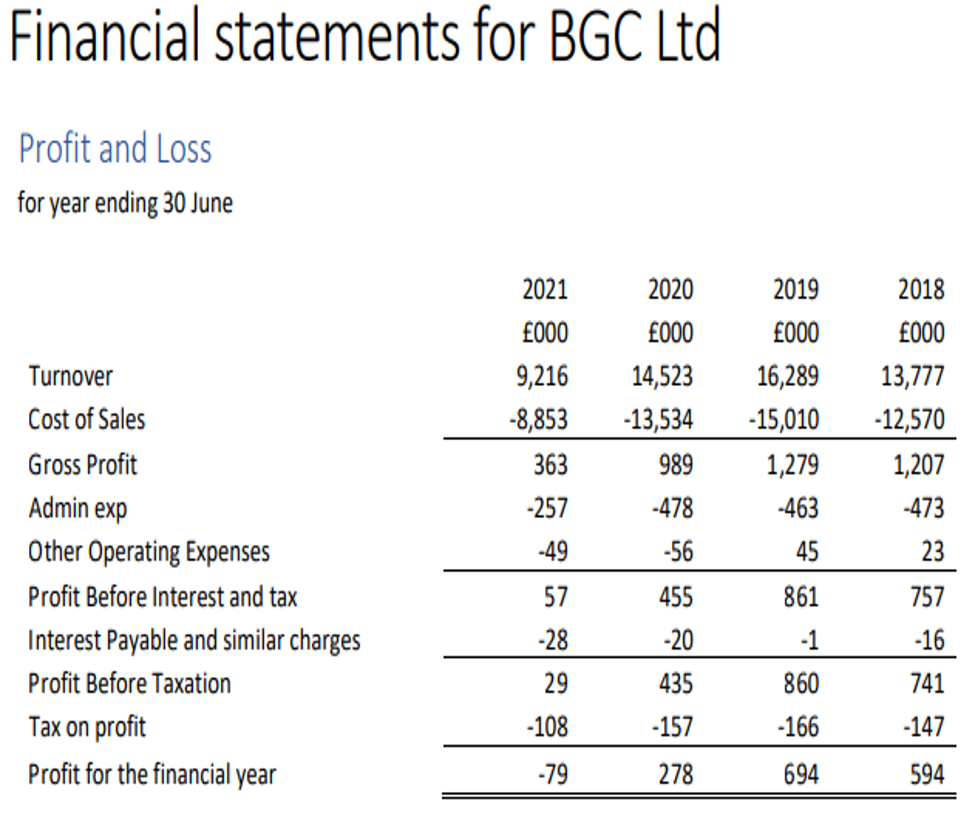
Table 1: Showing financial statement for BGC Ltd
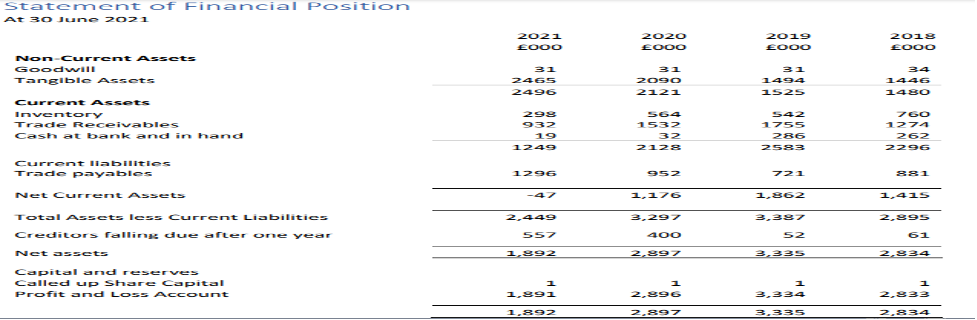
Table 2:Showing statement of financial position for BGC Ltd.
| BGC Ltd 2020 and 2021 Financial Ratios | Years | ||||
| Ratio types | Formula | ||||
| 2020 | 2021 | ||||
| Gross Profit Margin | (Revenue-COGS)/Revenue | 0.0681 | 0.0394 | ||
| Net Profit Margin | Net profit/revenue | 0.0192 | -0.8572 | ||
| Return on Capital Employed | EBIT/(Total asset-total current liabilities | 0.138 | 0.0233 | ||
| Current Ratio | Current asset/current liabilities | 2.2353 | 0.9637 | ||
| Working Capital Cycle | Timeline in which the company gets its money back | 43 days | 26 days | ||
| Gearing | Total debts /total assets | 0.1387 | 0.2944 | ||
| Interest cover | EBIT/Interest express | 22.7 | 2.0357 | ||
Table 3:Showing Financial ratios for BGC Ltd for the years 2020 and 2021
The calculation found different gross profit margins, net profit margins, return on capital employed, current ratio, working capital cycle, gearing, and interest cover ratios for the years 2020 and 2021. Percentages were calculated and displayed using a specific formula, as indicated in Table 3. These ratios are vital since they aid in making decisions regarding the company’s performance, liquidity, and solvency.
Part 2: Report
Executive summary
Financial ratios are critical concepts for any company. They help in measuring the company’s profitability, liquidity and solvency and, more so, the general performance of the company. In this case, from the calculation of the ratios, it was found to be essential to analyze BGC Ltd ratios, indicating its performance. Analysis of gross profit margins, net profit margins, return on capital employed and gearing ratios were performed to aid in making decisions. It was found that BGCLtd in 2021 had a decreased profitability; in 2020, there was a high current ratio, and in general, the company needed more solvency chances.
Introduction
Analyzing a company’s financial ratios offers valuable insight into liquidity, profitability, efficiency, and more concepts that regard the company’s performance. These ratios aid in visualizing how the company has performed over a given period, hence tracking the progress and having future projections by making critical decisions(Haralayya,2022). Therefore, being one of the largest companies, it is critical to analyze the financial ratios for BGC Ltd, which will help its directors understand its performance over the years 2020 and 2021, respectively. The analysis is based on gross profit margins, net profit margins, return on capital employed, current ratio, working capital cycle, gearing, and interest cover.
From the gross profit margin calculation, in 2020 a ratio of 0.0681, and in 2021, a ratio of 0.0394 is seen. This means that in 2021, there will be a decrease in gross profit, which is not profitable for BGC Ltd. In 2020 and 2021, the company had a net profit margin ratio of 0.1914 and -0.8572, respectively. It shows that the company had a net profit decrease in 2021, meaning a decrease in profitability. This may be due to costs incurred in hiring employees and buying more equipment. Thus, the company may be required to generate more revenue to cover such costs, leading to decreased profitability.
Return on capital employed is another crucial ratio for the company. In 2020, the company had a return on capital employed ratio of 0.1380, while in 2021, it had a ratio of 0.0233. These ratios indicate that the company needs to do a better job generating profits from its capital invested. In any company, capital investment at the right time always helps a company have the desired result. 2020, there is high capital utilization, while in 2021, there is a decrease. Thus, the BGC Company could be doing better from a profitable point of view. Another critical ratio is the current ratio, a liquidity ratio that measures a company’s capacity to pay short-term obligations(Samo & Murad,2019).
Furthermore, the calculation found that in 2020 and 2021, BGC Ltd had a current ratio of 2.2353 and 0.9637, respectively. Study shows that a good current ratio is always between 1.2 to 2. Therefore, from the calculation, BGC Ltd. had a better current ratio in 2020 than in 2021. The 2020 ratio means the company had two times its current assets than its liabilities, while a low or decreased ratio means its overall growth is affected(Baraja & Yosya,2019). Another essential financial ratio is solvency, which, in this case, is represented by the gearing ratio. In 2020, the company had a gearing ratio of 0.1381; in 2021, it had a ratio of 0.2944. Thus, the company has a lower chance of solvency.
Conclusion
Financial ratios are essential for any company to measure its performance, profitability and efficiency. For the diverse financial ratios, measuring BGC Ltd’s performance, profitability, and efficiency was crucial by analyzing its financial ratios such as gross profit margins, net profit margins, return on capital employed, current ratio, working capital cycle, gearing, and interest cover. For example, regarding net profit margin, in 2021, the company was found to have a decrease in profitability due to decreased net profit margin ratio. Also, in terms of liquidity ratio in 2020, the company had a high current ratio of 2.2353, meaning it had two times more current assets than its liabilities, increasing its performance. However, in terms of solvency, the company was found to have decreased solvency chances in both years, hence low performance.
References
Baraja, L., & Yosya, E. A. (2019). Analysis of the impact of liquidity, profitability, activity and solvency ratio on change in earnings. Indonesian Management and Accounting Research, 17(1), 1-17.
Haralayya, B. (2022). Impact of Ratio Analysis on Financial Performance in Royal Enfield (Bhavani Motors) Bidar. Iconic Research And Engineering Journals, 5(9), 207-222.
Samo, A. H., & Murad, H. (2019). Impact of liquidity and financial leverage on firm’s profitability–an empirical analysis of the textile industry of Pakistan. Research Journal of Textile and Apparel, 23(4), 291-305.
 write
write