Section 1: Financial Performance
Introduction
A full review of a company’s entire status in categories such as assets, liabilities, equity, costs, revenue, and overall profitability is known as financial performance analysis. It is calculated using a variety of business algorithms that allow users to determine precise data about a company’s prospective effectiveness. Internal and external parties undertake financial statement analysis on businesses to acquire a better understanding of how they are operating. Whether undertaken for internal or external usage, financial performance analysis is crucial since it aids in determining a company’s possible future development, structure, efficacy, and, most importantly, performance. In the business sector, there are seven essential ratios that are widely utilized to aid and assess a company’s overall success: these are the gross profit margin, the working capital, the current ratio, inventory turnover ratio, leverage, return on assets, and return on equity. The current ratio is a liquidity ratio that shows if a company has adequate current assets to cover or pay off its current liabilities. The inventory turnover ratio is a metric for determining how many times a company’s typical inventory is sold in a fiscal year. A firm calculates leverage as an equity multiplier to show how much debt is actually being utilized to acquire assets.
Current Ratio.
The first metaphor used to compare the company’s financial performance between 2020, and 2021 was the current ratio. The current rate assesses a company’s ability to meet short-term obligations, such as those that must be paid within a year. It explains to investors and analysts how a company can use current assets on its balance sheet to pay off current debt and other obligations. The current rate equal to or slightly greater than the sector estimate is generally considered appropriate. Current Ratio represents a summary of the company’s finances and solvency at any one time. A rating of less than 1.00 indicates that a company’s liabilities exceed its assets. More than one rating means that the company has financial resources that will be resolved in the short term. Different circumstances may have a negative impact on the current rating of a good company. Compared to what was historically common in the company and in the peer group, the current rating is an important indicator of the short-term solvency of the company. The maximum rating, over 3.00, indicates that the company’s current liabilities can be covered three times. A company that seems to be suffering right now, on the other hand, is likely to make significant progress in achieving a strong current rate.
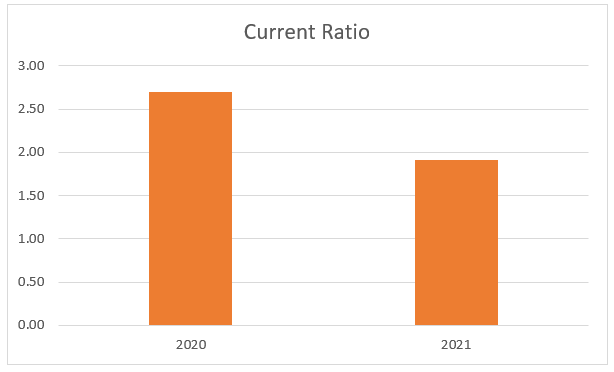
Figure 1: A bar plot illustrating the current ratio for year 2020 and 2021
As seen from the plot above, in the year 2020, the company had a current ratio of 2.70, while in the preceding year i.e. 2021, it had a current ratio of 1.90. This is an indicator that the company was performing better or rather it was more solvent in 2020 than in 2021. However as a general rule of thumb, a current ratio of more than 1.5 is considered a good current ratio as it indicates ample liquidity. In conclusion, during both years the company was solvent enough and had all its debts and assets balanced well and in check.
Gross Profit Margin
Gross profit margin, commonly known as gross margin, is a financial term that measures how successful a company’s operations are. A measure that measures a company’s sales success based on the efficiency of the production process. Like other financial systems, it is only useful if the mathematical input is correct. Direct costs are those that are directly related to an expensive item, such as a product, department, or project. Specific work, for example, refers to work done only on a particular product by employees. If the overall profit margin for a company varies considerably, it may indicate poor management and / or inadequate products. However, such flexibility can be guaranteed if the company makes significant operational changes to its business model, where the volatile situation should not be considered a cause for concern.
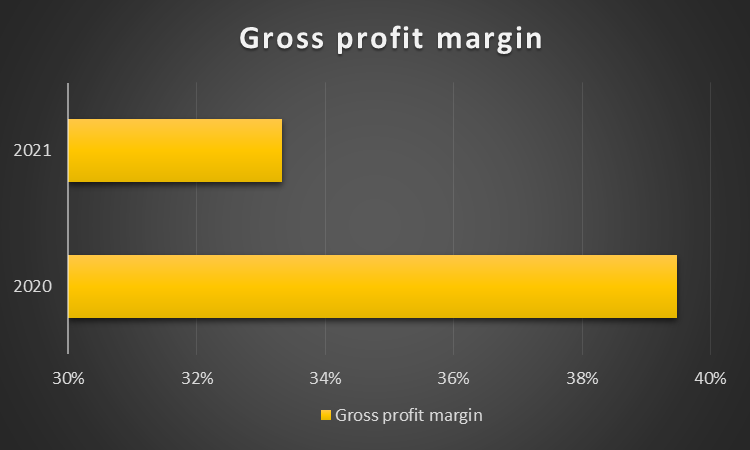
Figure 2: Gross profit margin bar chart
As seen from on the chart above, in the year 2020, Buildrite Company had gross profit margin of 39%, meaning that for every dollar made by the company, $0.39 is retained while $0.61 is attributed to the cost of goods sold. In 2021, Bildrite Company had a gross profit margin of 33%, which means that for every dollar made by Buildrite Company, $0.33 was retained, while $0.67 went towards the cost of goods sold. This is another metric that signals better company performance in 2020 than in 2021. Nevertheless; a gross profit margin of not more than 60% is considered a good gross profit margin since the costs are curbed below 50. In both years the cost of goods sold was well managed and proved to be sustainable.
Working Capital
Total current assets that are accessible to day-to-day operations are called operating capital. The current assets under the current liabilities are the definition, and the components of the test questions are usually the assets and receivables of the trade, trade payments, and bank overdraft. The main cause of the company’s failure to manage operating costs is, as a result, liquidity. Because the savings in active cash generate little or no interest, liquidity is important. As operating costs are insufficient, the company will not be able to fulfil its obligations when it is due, which will result in late payments to employees, suppliers, and other credit providers.
An increase in operating costs means an outflow of funds, while a decrease in operating costs reflects inflation. The main emphasis on pricing is still in the form of capital gains. Current assets do not include cash and other securities (such as treasury loans and other government securities). At the end of the study, the cash and marketable securities are added to the firm’s worth calculated using several valuation models to arrive at the overall value. All interest-bearing debt is excluded from current obligations, including short-term debt and a part of long-term debt. Noncash working capital as a proportion of sales might be estimated for forecasting reasons. On an annual basis, there may be variances in working capital. As a result, noncash working capital adjustments must be evaluated in connection to anticipated revenue fluctuations. Changes in noncash working capital can be both positive and negative. As current assets such as inventories are better handled, cash flow to the company grows as noncash working capital falls. Working capital as a proportion of sales can be used to assess variations in working capital from year to year. When non-debt current obligations exceed noncash current assets, working capital becomes negative.
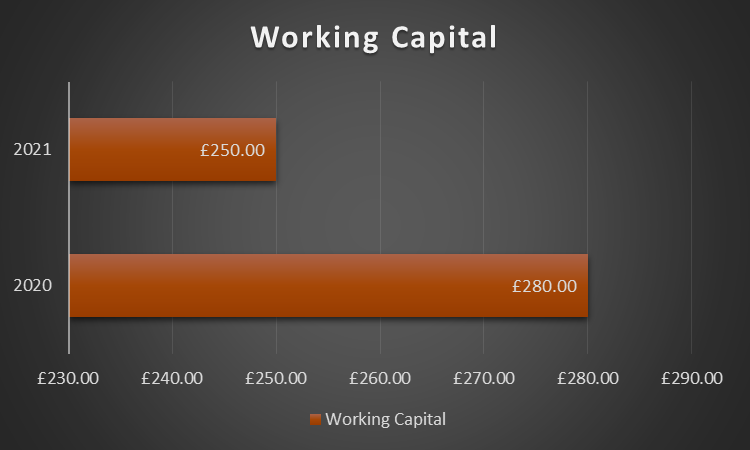
Figure 3: A bar chart of working capital for Buildrite Limited
As seen from the above visual, the working capital in 2020 was £280,000, and declined to £250,000 in 2021. In other words Buildrite limited was more operational efficient and was more stable in its short term financial health in the year 2020 than in 2021. However, this can be argued out since the increased working capital might be as a result of money owed to the company or money held up in the inventory. In conclusion, working capital indicates the ability of the company to honour its short term debts and obligations but it’s not a good measure for the company’s financial health.
Leverage
The use of a loan to finance the acquisition of an asset in the hope that the income of a new asset or higher profits will exceed the borrowing costs is known as financial strength. Losses may arise when the asset interest liability obligations are beyond the borrower’s ability because the repayment of the asset is insufficient. If the value of the asset declines or interest rates reach unacceptable levels, this may be the case. Income and revenue are more likely to be different from a company with low entry barriers. Lenders are reluctant to offer additional credit to companies with a higher rate of credit-to-equity as the risk of non-payment is higher. A company like this may be at risk of volatile sales volatility may affect its EBIT and return on investment.
If a company’s financial (or asset credit) ratio is high, it means that they are spending more money to pay off debts and are less likely to pay off debts. If it is low, it can be a sign that the business is posing a small risk to shareholders and credit bureaux, but it may also indicate that it is not putting any risk at all to lenders. Debt-to-equity ratio is undoubtedly the most prominent financial figure. A 0.1 rating indicates that an entity is virtually indebted in terms of equity and a 1.0 rating implies that the company’s debt and equity are equal. What can be considered a “normal” number varies from one to another, depending on factors such as size, maturity, and industry.
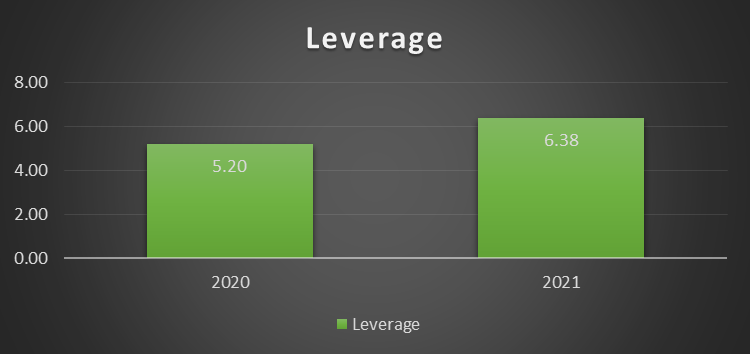
Figure 4: Financial Leverage chart for Buildrite Limited from 2020 to 2021
Based on the chart above, the financial leverage ratio was higher in 2021 i.e. 6.38, than in 2020 i.e. 5.20. This is an indicator that Buildrite limited was using debts to finance operations and acquire assets more in 2021. It is clear that Buildrite Limited was in more debts in the year 2021, than in the year 2020, financial or rather debt performance was better in 2020, and deteriorated in the preceding year according to this metric.
Conclusion
An overall chart depicting the financial performance of Builrite limited in 2020 and 2021 is attached below. Generally, the company performed better financially during 2020. This might be attributed to the Out-break of the COVID-19 pandemic, which affected multiple industries, sectors, and businesses worldwide.
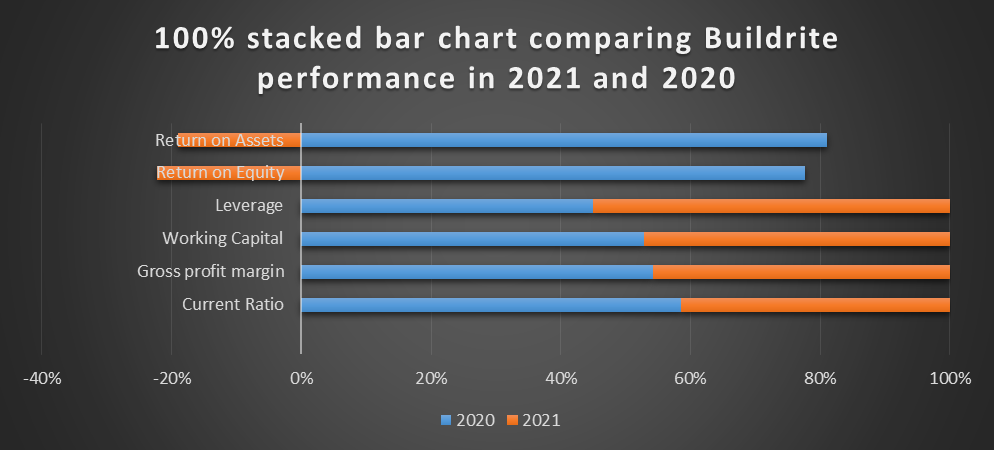
Figure 5: 100% stacked bar chart comparing overall performance of Buildrite Limited between 2021 and 2020
Non-financial performance Indicators
Non-financial performance measures provide information about a company’s performance in terms of non-financial or financial terms. These guidelines help determine the quality of a company’s product or service. For example, an airline may use these metrics to measure performance, such as customer complaints, baggage losses, punctuality, and so on. Non-financial measurements aid in identifying a company’s key skills as well as areas in need of improvement. They teach employees how minor details, such as daily attendance, may have a significant impact on productivity. They also assist businesses in determining the influence of external variables such as a recession, an act of God, or a conflict on their operations. Non-financial data cannot be measured in the same manner as financial data, and various firms may use different instruments to do so. There are questions over whether the result represents what it should or if it is simply a measuring error. These factors should be addressed in addition to the financial ones; otherwise, the intended outcomes may not be achieved.
Customer performance indicators
| Customer Performance Indicators | 2020 | 2021 | Percentage Change |
| Number of jobs completed in the year: | |||
| Domestic customers | 91 | 120 | 32% |
| Commercial customers | 14 | 15 | 7% |
| Total | 105 | 135 | 29% |
| Percentage of customers complaints | 4% | 8% | 100% |
| Average number of weeks taken to complete each job | 5 | 12 | 140% |
| Number of customers waiting for work to begin | 10 | 35 | 250% |
| Average number of weekly visitor’s to Buildrite’s website | 8 | 15 | 88% |
| Percentage of positive social media comments | 90% | 72% | -20% |
Table1: Customer performance indicators
According to the above table, most positive indicators had a significant improvement from the year 2020, to the year 2021. Domestic customers increased by 32%, while Commercial customers increased by 7%. In total the number of jobs completed increased by 29% from 2020 to 2021. Also, there was an 88% increase in the average number of weekly visitor’s to Buildrite’s website from the year 2020 to the year 2021; a big win for Buildrite limited. On the negative side, the percentage of customers complaints increased by 100%, which might have been as a result of the increase in the average number of weeks to complete each job. The average number of weeks taken to complete each job increased by 140% from 2020 to 2021. Additionally, the number of customers waiting for work to begin i.e. in the queue increased by 250% from 2020 to 2021. Finally, the biggest setback to Buildrite limited is observed in the 20% decline in the percentage of positive social media comments. A negative image for the company would mean a decline in the number of customers but this did not seem to be the case at Buildrite limited.
Staffing performance indicators
| Staffing performance indicators | 2020 | 2021 | Percentage Change |
| Number of staff: | |||
| Building staff | 10 | 10 | 0% |
| Administrative staff | 2 | 2 | 0% |
| Directors | 2 | 2 | 0% |
| Total staff | 14 | 14 | 0% |
| Average number of sick days per person | |||
| COVID-related (including self-isolating) | 2 | 14 | 600% |
| Non-COVID related | 3 | 2 | -33% |
| Totals | 5 | 16 | 220% |
| Total number of subcontractors used | 30 | 52 | 73% |
Table2: Staffing performance indicators
On staffing performance indicators, there was no changes in the number of staff hired at Buildrite limited. The only significant change is evident in the number of sick days per person, and the number of subcontractors used. The total average number of sick days increased by 220% from the year 2020, to the year 2021: however; majority of the sick days were COVID-related. The total number of subcontractors used increased by 73% from the year 2020, to the year 2021. This might be attributed to the increase in the number of sick days per person or the increased number of customers waiting for work to commence (or in queue).
Section 2: Budgeted Operating Profit (or Loss)
| Budgeted Operating Profit (or Loss) for the year to December 2022 | ||||
| Domestic customers | Commercial customers | Totals | ||
| Expected number of jobs | 100 | 15 | ||
| Average revenue per job | £ 24,000 | £ 120,000 | ||
| Total Revenue | £ 2,400,000 | £ 1,800,000 | £ 4,200,000 | |
| Average costs per job | ||||
| Materials costs | £ 960,000 | £ 810,000 | £ 1,770,000 | |
| Labour costs | £ 2,500 | £ 18,000 | £ 20,500 | |
| Subcontractor costs | £ 7,000 | £ 30,000 | £ 37,000 | |
| Gross Profit | £ 2,372,500.00 | |||
| Administrative Costs | £ 800,000 | £ 800,000 | £ 1,600,000 | |
| Operating Profit | £ 772,500.00 | |||
Table3: Budgeted Operating Profit (or Loss)
Reasonableness of the forecasts and assumptions made
Management must compute a realistic cost for its product in order to correctly estimate sales and income (s). All manufacturing inputs must be included in this cost, including raw materials, utilities, packaging, handling costs, and any other elements. These per unit costs would have to be calculated separately for each unique product produced. Value isn’t the same as price. In the viewpoint of the client, value is a perception. If Buildrite Limited offers a one-of-a-kind product or service that the client requires or desires, the consumer will value it more highly. The fixed pricing should represent the customer’s opinion on Buildrite’s products. The management will be able to monitor and plan for its cash-flow requirements document by using a spreadsheet that allows for rapid revisions during the anticipated year and handles changes (such as salary hikes, personnel changes, and so on). The creation of the expected income statement is the financial plan’s profit planning.
Overestimation of sales expectations might lead to financial ruin. It is necessary to establish key assumptions in order to produce an accurate cash flow projection. Buildrite Limited’s management will need to get amortization tables for all loans requested for. This will provide them the interest and principal split of any loans that are sought for approval.
Section 3: Investment Appraisal Calculations
| Discounted cash flow | Payback period | |||
| Year 0 | -£ 100,000.00 | -£ 100,000.00 | -£ 75,000.00 | |
| year 1 | £ 25,000.00 | £ 23,800.000 | -£ 45,000.00 | |
| Year 2 | £ 30,000.00 | £ 27,210.000 | -£ 10,000.00 | |
| Year 3 | £ 35,000.00 | £ 30,240.000 | £ 25,000.00 | break-even point |
| Year 4 | £ 35,000.00 | £ 28,805.000 | ||
| Break-even point | 3.3 | |||
| NPV | £ 10,055.00 | |||
| Payback period | 3.3 years | |||
| NPV using excel | $9,570.77 | |||
| IRR | 9.0032% | |||
Table4: Investment Appraisal Calculations
Recommendations
Based on the investment appraisal calculations done, the management of Buildrite Limited should proceed with the proposed investment plan. The NPV indicates that the project will result into a positive cashflow at the end of the investment period. The payback period also is lesser than the projects projected lifespan, indicating that the injected capital, the project will break even in the first quarter of the third year. This is also an indicator that the investment will generate profits to Buildrite limited at the of the projects lifespan.
Financing Decisions
Companies want the cheapest funding available, everything else is equal. Because debt is often less expensive than equity, debt is almost always the best option. Debt is less expensive than equity because interest rates are tax deductible, and creditors ‘expected benefits are lower than equity holders (shareholders). Credit is low risk and high returns. However, there are limitations on Debt – a company may not be able to exceed a certain Debt / EBITDA rate, or it may be required to keep EBITDA / its Interest above a certain level. As a result, management should first evaluate these issues to determine how much Debt a company can increase, or whether it should rely on Equity or a combination of Credit and Equity.
References
Iona, A. (2019). Modelling the Relation between Managers, Shadow Cost of External Finance and Corporate Investment. Mathematics, 7(11), 1050.
Sedliacikova, M., Moresova, M., Alac, P., & Drabek, J. (2021). How do behavioral aspects affect the financial decisions of managers and the competetitiveness of enterprises. J. Compet, 13, 99-116.
 write
write