Introduction
Statistical process control methods are used to measure and control quality during a process. A control chart is one of the most useful tools in Statistical Process Control Methods. A control chart keeps track of data and alerts you if anything unexpected happens. Control charts usually have two different types of processes to choose from. The terms “common cause” and “special cause” describe these differences. The common cause is crucial to the process and will always be present. If the process is statistically out of control, a special cause emerges. The contract closeout phase of the acquisition process will be evaluated for this assignment.
Flowchart for Process Improvement
Pepsi Company should have the highest processes and standards in place to ensure that the quality of its products is consistent now that it has expanded its supplier base and beverage drink portfolio. As a result, the bottling process for Pepsi can be improved to ensure that value is added to the process. Identifying, analyzing, and improving a current business process are all part of process improvement (Castro, F., 2019). The bottling process will be improved to eliminate any weak bottlenecks or points in Pepsi’s business operations. Reduce the process’s completion time, eliminate wasted efforts, and scale new merchandise more quickly to improve the process.
The operating units should be more interconnected because the process structure should be more consistent and focus on reducing resource duplication. Process performance metrics are used to assess how well a process is performing and how well individual goals have been attained. Performance metrics allow a company to generate data, which improves the effectiveness and efficiency of decision-making. Cycle time and lead time, waiting states, throughput, costs of resources consumed, and inventory turnover are some variables that can be used to assess the existing bottling process.
The lead time metric allows a company to determine how long work items take to move through a system. The lead time is the amount of time it takes for a task to be completed, from when it is requested to when it is delivered (Castro, F., 2019). Analyzing operation cycle time also allows a company to see how long work items take to move from one step to the next. The operations team can identify areas for improvement by comparing the time it takes for tasks to stay in one cycle to the lead time for the bottling process.
Second, Pepsi can improve the speed of operations by using waiting states between stages in the bottling process. Measuring how long tasks sit in queues, such as how long cases sit in warehouses before being picked up by distributors, can help reduce total cycle time and improve speed dramatically. The average number of processed items in a given period is known as throughput. Pepsi’s operations team can track throughput to see how much work can be processed in a given time and how that affects business choices. The cost of resources used in the Pepsi bottling process aids the company in identifying areas where it needs to make improvements and improve cash flow to become more profitable.
Finally, inventory turnover measures how many times Pepsi’s inventory is sold in a given period (Milewski, D., 2022). From the time the materials are delivered to the factory until distributors collect the final product, the metric will be utilized to increase the accuracy and efficiency of the entire bottling process.
Control Chart & Process Metrics
Evaluation of the Process
In a process, the lean idea entails eliminating waste and non-value-adding components. The lean approach can be used to explore ways to eliminate waste in the Pepsi bottling process. Internally, the process is evaluated by looking for opportunities to combine processes and similar activities. Pepsi’s supply chain and distribution will be shortened, reducing the time it takes to create and distribute its products. Defects, waiting, inventory, and transportation are all lean waste. The notion of lean, such as value, specifies a customer’s requirement for Pepsi products, necessitating a reduction in the lead time and cycle time between ingredients being delivered to the factory and product delivery.
To detect non-value-adding activities, value streaming will identify the steps that take Pepsi through the bottling process. The concept of flow will ensure that the process runs smoothly without interruptions, bottlenecks, or delays once measures to remove waste have been found. Customers will be able to pull Pepsi goods when needed as a result of increased flow, saving money for Pepsi, the bottling firms, and the consumers. When it comes to enhancing the bottling process, making lean thinking a part of Pepsi’s culture will assure the company’s success.
Analyzing the Control Chart and the Process Metrics
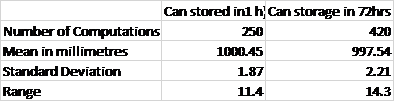
Pepsi has to improve and ensure quality in PET bottle production by eliminating waste and rejects. Injection, blow, stretch, and molding are all used in producing these bottles. Statistical process control (SPC) effectively lowers production costs and improves the quality of PET bottle packaging. After being blown, some bottles are stored in the silo instead of being filled with a soft drink during manufacturing. When these bottles are stored before being filled, they shrink, resulting in bottles of varying sizes. An experiment was carried out to track the number of bottles produced. The results were divided into two categories: bottles filled right after molding and bottles stored for 72 hours before filling.
A visual representation of the company’s process.
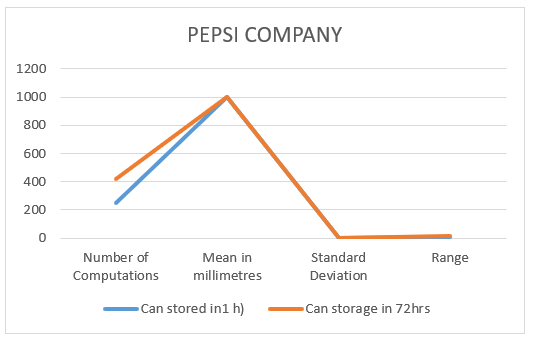
Figure 1
The maximum limit of bottle filling is 1005 ml, while the lowest is 995 ml. The capability of manufacturing highly effective can be calculated using index Cp and Cpk. Cp represents the capability of the process. The manufacturing process would be effective if Cp is greater or equal to 1. Cpk represents the rejects and faulty bottles produced. When the index value is equal to 1 or greater, no faulty bottles are produced.
Executive Summary
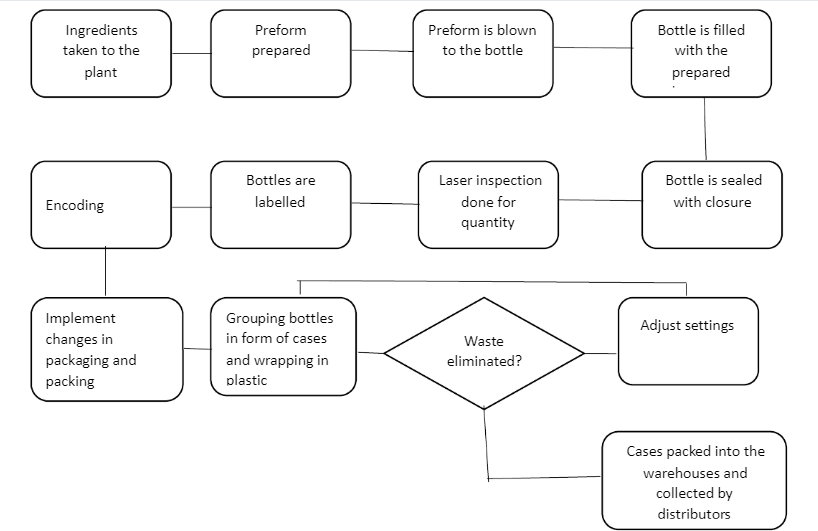
Pepsi has a structure, just like any other successful business. Although the corporation manufactures and distributes syrups and concentrates to bottling plants, Pepsi retains the brand and does consumer brand marketing. Ingredients are sent to local companies to begin the process of bottling Pepsi. The preform is then made from microscopic plastic pieces known as resin. After that, the preform is blown into the appropriate bottle. After that, the bottle is filled with a drink and sealed with a closure. Labels are applied, and a laser checks for under or overfilling of the bottle with the beverage. The bottle is then encoded, and the bottles are placed in cases. The cases are then wrapped around with plastic pieces, and the bundles of cases are packed together. The cases are then transported to warehouses, where distributors pick up the orders.
Reducing the operating cycle time minimizes the time it takes for work items to move from one stage to the next (Milewski, D, 20220. Additionally, by identifying procedures that may be completed simultaneously, lead time can be decreased. Then, when jobs wait to move on to the next process, speed can be enhanced by minimizing queues. Pepsi, for example, uses the First In, First Out approach in its warehouse. Just-in-time (JIT) delivery systems assist in speeding up deliveries, enhancing quality, and saving warehouse holding costs (Kumar et al., 2018). Pepsi’s throughput, for example, is determined by the number of bottles that can be labeled in one hour. Throughput allows the company to estimate the time it will take to complete each process stage. Costs such as holding costs and opportunity costs are avoided by consolidating several operations into one stage, using techniques like just in time, and optimizing revenues.
Finally, enhancing the entire process from beginning to end improves inventory turnover because the process dictates the beverage’s sales in a certain period. Based on the changes in the bottling process, the future process will considerably add value to the process, maintain quality consistency, and minimize production costs. To begin, weak bottlenecks will be addressed by determining the throughput at each stage of the bottling process to avoid any bottlenecks or delays. As a result of the reduced lead time and operation cycle time, customers will be satisfied with quick and timely deliveries (Kawa, A., 2019). Processes that can be done simultaneously are merged, so there are no wasted efforts. The full adoption of inventory management techniques such as just-in-time, material requirement planning, and material resource planning will significantly reduce costs by reducing holding and damage costs.
The process improvement project aims to minimize waste and reduce resource and human effort duplication. In addition, the process aims to cut costs such as warehouse holding costs. Pepsi is a well-established multinational corporation that has been operating for decades; these enhancement approaches attempt to improve the Pepsi bottling process, which is especially important in this technological age.
Conclusion
One of the approaches used by modern organizations to improve performance and consumer perceptions in the global market is the lean concept (Sommer, A, 2019). The strategy is used to determine and improve client attitudes toward a specific brand. Wastage, bottlenecks in the distribution network, and faulty products are some of the issues that have a negative impact on consumer perceptions. Pepsi Company is currently dealing with a number of issues that are affecting its financial performance. Market penetration, as well as market share and stock price erosion, are examples of such issues. In this paper, I developed a strategy to demonstrate how the lean concept can be used to solve these issues. The strategy was based on the constraints theory’s assumptions. Pepsi Company’s market performance is likely to improve if it follows the recommended strategy.
References
Castro, F., Figueiredo, P. S., Pereira-Guizzo, C., & Passos, F. U. (2019). Effect of the motivational factor on lean manufacturing performance: the case of a multinational consumer go
Kawa, A., & Maryniak, A. (2019). Lean and agile supply chains of e-commerce: empirical research. Journal of Information and Telecommunication, 3(2), 235-247.ods company. Gestão & Produção, 26.
Milewski, D. (2022). Managerial and Economical Aspects of the Just-In-Time System “Lean Management in the Time of Pandemic”. Sustainability 2022, 14, 1204.
Sommer, A. C., & Blumenthal, E. Z. (2019). Implementation of Lean and Six Sigma principles in ophthalmology for improving quality of care and patient flow. Survey of ophthalmology, 64(5), 720-728.
 write
write