Introduction
This study examines the factors affecting the price of cars in the USA. The research focuses on several economic factors, including Gross Domestic Product, Unemployment rate, Inflation, and interest rates and their impacts on the average price of cars. Several studies have been carried out to determine the association between car prices and macroeconomic factors such as Gross Domestic Product, Unemployment Rate, Inflation, and interest rate. Based on the research, several macroeconomic factors have been identified to impact car prices over time. These factors identified to have an effect include Gross Domestic Product, Unemployment Rate, Inflation, and interest rate.
Similar to the correlation between the total number of automobiles on the road and the nominal GDP found by Islam et al. (2016), average car prices show a high correlation with GDP growth. In contrast to the association between the total number of cars in use and prices and nominal GDP, the one between new car sales and GDP is weaker. Automotive Research by Islam et al. (2016) found a significant association between annualized GDP growth and growth in vehicle sales and price increases in the United States. It concluded that this relationship requires maintaining 3% or more significant GDP growth. If the yearly growth rate of the gross domestic product drops below 1%, then we can anticipate a decline in vehicle sales and prices. Rising deals and fluctuating car prices are observed only when the GDP is more than 3.0. These results demonstrate a strong correlation between GDP and the cost of automobiles and their popularity among buyers in the United States.
There is a strong relationship between GDP and sales of passenger cars in European Union countries, as reported by Nawi et al. (2013). This study’s findings demonstrate a strong linear relationship (r = 0.95) between GDP and the number of passenger cars on the road. The data strongly suggests that a slowdown in GDP will result in a decline in passenger cars on the road. From 1998 to 2008, Pilinkus & Boguslauskas (2009) examined the connection between worldwide auto sales and car average prices and GDP worldwide. According to the data, international car sales and prices correlate with GDP growth.
Inflation, interest rates, and the rate of unemployment were also examined. Among these is the investigation of domestic and international automobile costs conducted by (Rasheed, Ishaq & Malik 2022). This study found that the pricing of automobiles was very susceptible to changes in any of the studied variables. However, heteroscedasticity in this regression model made it less accurate for comparing prices in different countries. This study demonstrates that all of these factors considerably impact car prices. However, heteroscedasticity was a drawback that could have improved the model’s overall performance.
However, Pham et al. (2019) examined the effect of monetary policy on automobile sales and prices, which they believed to be caused by the availability of car loans from financial institutions. It was determined that an increase in the federal funds rate would significantly affect vehicle sales. The inability of commercial banks to issue auto loans is to blame. The purpose of the research conducted by Pham et al. (2019) is to analyze the effect of InflationInflation on vehicle sales and pricing in South Africa from 1969 to 2018. The research concluded that InflationInflation causes a domino effect (one-way causality) on sales and prices of new automobiles.
This study tries to assess the impact of microeconomic factors on the price of cars. The macroeconomic factors examined by the survey were Inflation, unemployment rate, interest rates, and gross domestic product. The following hypotheses were tested for the study.
Research hypothesis
- To assess the relationship between the gross domestic product and the average car prices
- To access the relationship between InflationInflation and the average prices of cars
- To assess the relationship between the unemployment rate and the average car prices
- To Access the relationship between interest rates and average car prices.
Research Methodology
Data Collection Plan
Secondary data was used in the analysis. The research relied on secondary resources, especially from the macro trends website, to fill in the gaps in primary sources. The data was collected between 1991 and 2022, including all the variables of interest. The data-collecting strategy started with defining the type of secondary data (economic data) that needed to be gathered and analyzed. The next stage was to recognize the secondary data sources. Several data repositories were found, including the macro trends database.
This website was chosen because it was generally accepted as a reliable source of information in the United States. Data on the US GDP was obtained using the following link: https://www.macrotrends.net/countries/USA/united-states/gdp-gross-domestic-product. In contrast, the unemployment rate was obtained from the macro trends website using the following link: https://www.macrotrends.net/countries/USA/united-states/unemployment-rate, the inflation rate was obtained from the macro trends website using the following link https://www.macrotrends.net/countries/USA/united-states/inflation-rate-cpi, the interest rates were obtained using the following link https://www.visualcapitalist.com/sp/visualizing-40-years-of-u-s-interest-rates/, and the average car prices were obtained from the following link https://wgntv.com/news/the-average-car-now-costs-25449-how-much-was-a-car-the-year-you-were-born/. The researcher then entered keywords reflecting the primary factors into these sites to extract the data, which were then analyzed using Microsoft Excel. All data sets generated between 1991 and 2022 qualified for inclusion.
Approach Method
The study analyzed the research aims using a logical technique. The starting point for this strategy was formulating a theory about the economic factors influencing annual average car prices during the past 32 years. According to this method, macroeconomic variables such as GDP, Inflation, unemployment, and interest rates affect average yearly car prices. The deductive approach helped assess the correlation between the dependent and independent variables. Furthermore, inferential studies necessitating data extrapolation were made possible.
Test Design
The quantitative study used a descriptive research methodology and statistical techniques, including regression and correlation analysis. An explanatory research strategy was implemented to understand the dataset’s nature further and extract meaningful insights. Problems with the data set, such as outliers or a lack of normality, were more easily spotted with the help of the descriptive design.
Linear regression analysis and correlation analysis followed as the next method of testing in the investigation. The design established a linear connection between the dependent and independent variables. In this analysis, average car prices served as the response variable, while interest rates, unemployment rate, U.S. GDP, and inflation were predictor factors. All calculations were done in Excel, and the results were visualized and presented in several ways.
Data Analysis
Exploratory Data Analysis
This part involved exploring the data to identify relationships and associations within the data. Visual elements such as scatter plots were used to assess the relationships between variables of interest.
Correlation Analysis between the unemployment rate and the average annual car prices
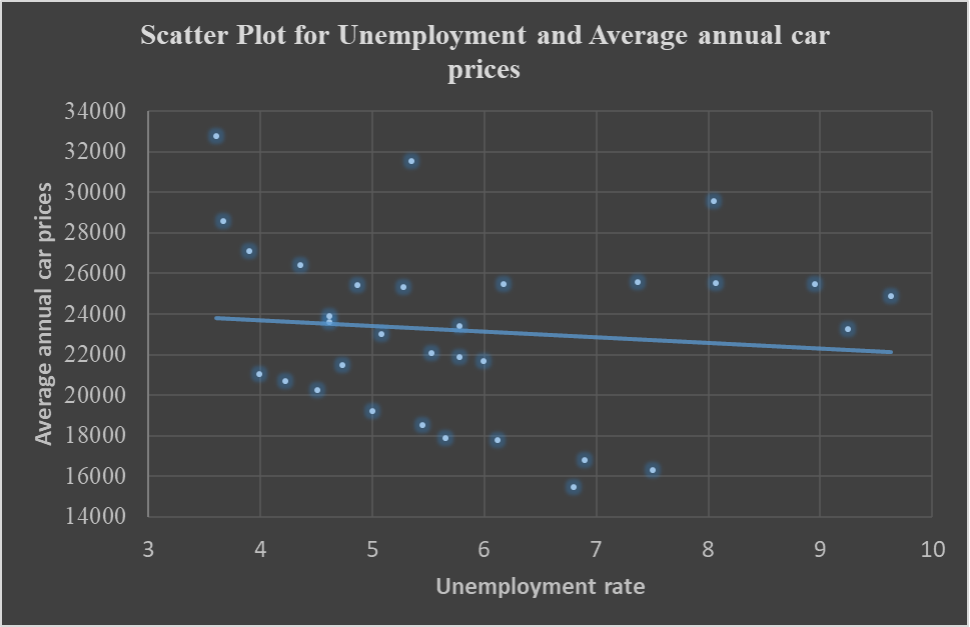
The scatter plot shows a slightly weak negative correlation between the unemployment rate and average annual car prices. This implies that the average car prices tend to increase proportionally as unemployment decreases. This could be attributed to increased income for most people, and the demand for cars is high; thus, with low levels of unemployment, there is a high average annual increase in the price of vehicles.
Correlation Analysis between gross domestic product and the average annual car prices
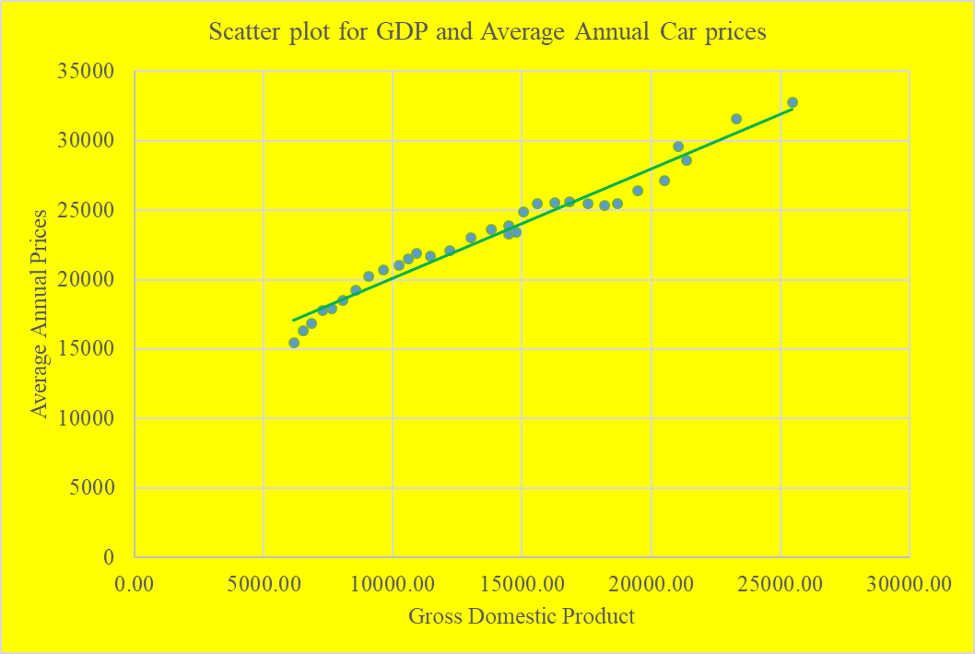
The scatter plot from a glance indicates the presence of a strong positive linear association between Gross Domestic Product and Average annual car prices, which is almost perfect. This implies that an increase in the GDP of the USA from one year to another result in a proportionate rise in the average annual price of cars. As GDP increases, the household income tends to grow, and the demand for cars also tends to go up, thus the increase in the price of vehicles.
Correlation Analysis between Inflation and the average annual car prices
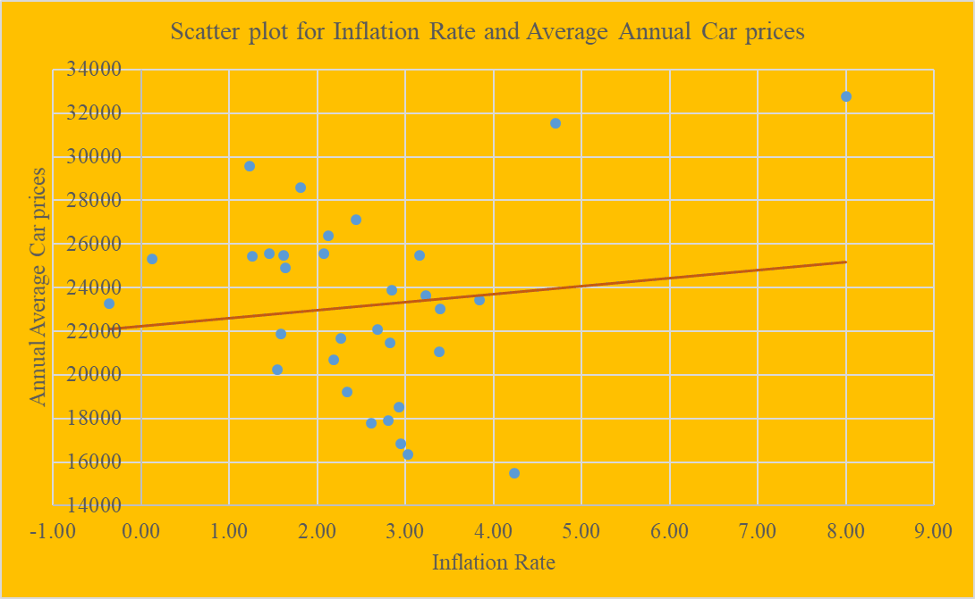
The scatter plot from a glance shows a weak positive correlation between the Inflation rate and the average annual car prices. This implies that as the inflation rate increases, the average yearly car prices also tend to increase proportionally. This is because inflation in a country is always linked with increases in the prices of various products and services. And so is the case here with high inflation; there is a high average increase in car prices.
Correlation Analysis between interest rates and the average annual car prices
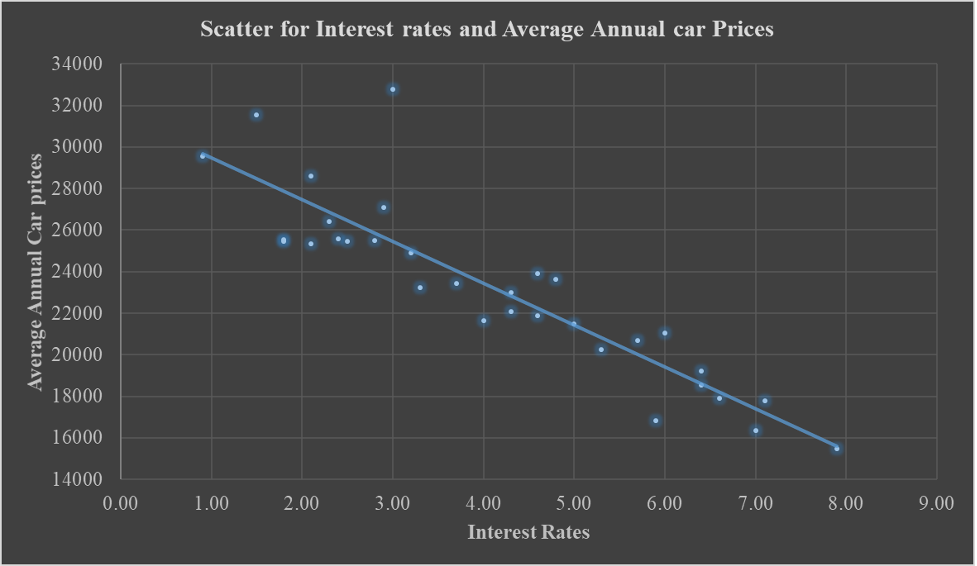
The scatterplot indicates an inverse relationship between Interest rates and Average annual car prices. As interest rates increase, the average yearly car prices decrease proportionally. This is because high interest rates result in low demand across the economy, resulting in excess supply and low inflation and, thus, reduced costs of products such as cars and other services. This is the reason behind the inverse relationship observed between interest rates and car prices.
Correlation Analysis
This part computed correlation analysis using the Pearson product-moment correlation coefficient for each predictor variable and the corresponding response variable. The correlation was used to assess the strength of the association as well as the direction of the relationship. The predictor variables in this case were the Gross Domestic Production, Inflation Rate, Unemployment Rate, and Interest rates, and the response variable was Average annual car prices.
Correlation Table
| Average price | Unemployment Rate | GDP | Inflation Rate | Interest Rate2 | |
| Average price | 1 | ||||
| Unemployment Rate | -0.10795427 | 1 | |||
| GDP | 0.981453868 | -0.123518311 | 1 | ||
| Inflation Rate | 0.124704186 | -0.332302911 | 0.09525573 | 1 | |
| Interest Rate2 | -0.89642315 | -0.120031029 | -0.9026697 | 0.225227105 | 1 |
From the table, the correlation coefficient between the average price and the Unemployment rate is -0.1080, which is a weak negative inverse correlation, denoting that an increase in the unemployment rate will decrease the average annual car prices. The linear association between Average annual car prices and GDP is a powerful positive linear relationship, indicating that as GDP increases, the average cost of cars also tends to increase proportionally in the same direction. The linear relationship between the average annual price of vehicles and the Inflation rate is a positive linear relationship, which indicates that an increase in the inflation rate results in a proportional increase in the average car prices in the U.S. The linear relationship between interest rates and the average annual car prices is a strong negative linear association, which indicates that high-interest rates result in low costs of cars due to increased supply and low inflation accompanied by soft demand in the market.
Correlation coefficients do not always indicate significance based on the size, and thus, to identify if the association was indeed significant, regression analysis that assesses the effect of the predictor variables on the response variables was carried out.
Regression Analysis
Regression Analysis was carried out to assess the effect of GDP, Inflation, Interest, and unemployment rates on the average annual car prices in the U.S.
Summary Output of the model
| Regression Statistics | |
| Multiple R | 0.984387129 |
| R Square | 0.96901802 |
| Adjusted R Square | 0.964428097 |
| Standard Error | 802.7055579 |
| Observations | 32 |
From the model output, the coefficient of determination is 0.9690 or 96.90%; this R-squared value indicates that the predictor variables have explained 96.90% of the variation in the annual car prices, and the remaining 3.1% can be explained by other factors not included in the model.
One-Way Analysis of Variance (ANOVA)
| df | SS | MS | F | Significance F | |
| Regression | 4 | 5.44E+08 | 1.36E+08 | 211.1186 | 6.00662E-20 |
| Residual | 27 | 17397078 | 644336.2 | ||
| Total | 31 | 5.62E+08 |
From the one-way analysis of variance, the F calculated value is F (4,27) = 211.1186, and the p-value corresponding to the test statistic is p < 0.001, which is less than 0.05 level of significance, indicating that the model is significant at a global level.
Multiple Linear Regression Model
| Coefficients | Standard Error | t Stat | P-value | |
| Intercept | 16509.38396 | 2732.157262 | 6.042618 | 1.89E-06 |
| Unemployment Rate | -26.48902218 | 106.0537819 | -0.24977 | 0.804656 |
| GDP | 0.598960413 | 0.102335383 | 5.852916 | 3.12E-06 |
| Inflation Rate | 309.6770886 | 145.8714504 | 2.122945 | 0.043074 |
| Interest Rate2 | -554.945533 | 291.3493852 | -1.90474 | 0.037518 |
The regression model is of the form:
Average price = 16509.38 -26.49 (Unemployment rate) + 0.599 (GDP) + 309.677 (Inflation Rate) – 554.946 (Interest rate)
This model means that holding all other factors constant at zero, the average annual car price is 16509.38. Holding all other factors constant, a unit change in the unemployment rate will result in a 26.49 change in the yearly average car price. Holding all other factors constant, a unit change in the GDP will result in a 0.599 average annual car price change. Holding all other factors constant, a unit change in the Inflation rate will result in a 309.677 change in the yearly average car price. Holding all other factors constant, a unit change in the Interest rate will result in a 554.946 change in the average annual car price.
The probability value corresponding to the coefficient of the unemployment rate is p = 0.80, which is greater than the 0.05 significance level. Thus, the null hypothesis was not rejected, implying that the unemployment rate does not significantly impact the annual average car prices. The probability value corresponding to the coefficient of Gross Domestic Product is p < 0.001, which is less than 0.05 level of significance. Thus, the null hypothesis was rejected, implying that the Gross Domestic Product significantly impacts the annual average car prices. The probability value corresponding to the coefficient of the inflation rate is p = 0.04, which is less than 0.05 level of significance. Thus, the null hypothesis was rejected, implying that the inflation rate significantly impacts the annual average car prices. The probability value corresponding to the coefficient of interest rate is p = 0.037, which is less than 0.05 significance level. Thus, the null hypothesis is rejected, implying that unemployment significantly impacts the annual average car prices.
Accessing the adequacy of the model
The adequacy of the model was assessed using the coefficient of determination and the normal probability plot. The coefficient of determination for our model was observed to be 96.9%, which indicated that the model was adequate for inferences and decision-making. The normal probability plot was used to assess whether the error terms in the model were usually distributed.
Normal Probability model
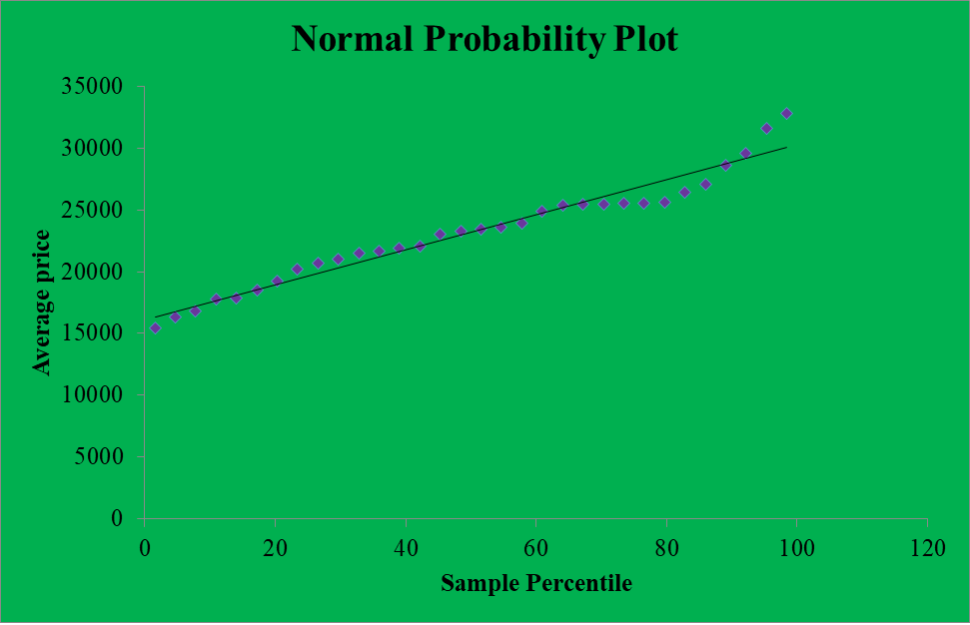
From the normal probability plot, it is clear that most of the points are aligned along the reference line. This indicates that the model’s error terms were approximately normally distributed. Thus, the model was adequate for modeling, prediction, and decision-making.
Conclusion and Recommendation
Economic factors are key factors that influence the prices of cars in many countries across the globe. The research focused on several economic factors, including Gross Domestic Product, Unemployment rate, InflationInflation, and interest rates and their impacts on the average price of cars. The study sought to determine the relationship between the Gross Domestic Product and Car prices, Unemployment rate and Car prices, InflationInflation, and car prices, and interest rates and car prices.
From the data visualization using scatter plots, it was evident that there was a strong positive correlation (r = 0.98) between the gross domestic product of the USA and the average annual car prices, an indication that GDP could be one of the critical factors that have an impact on the car prices change of values across the years. It was also observed that there was a strong negative correlation (r = -0.896) between the interest rates and the average annual car prices, an indication that interest rates have a negative impact on the car prices that is when they are high the car prices tend to go down due to increased supply and low demand. It was also observed that there was a weak negative correlation (r = -0.108) between the unemployment rates and the average annual car prices, indicating that unemployment rates negatively impact car prices. When unemployment rates are high, the car prices tend to go down. It was also observed that there was a weak positive correlation (r = 0.125) between the inflation rates and the average annual car prices, an indication that inflation rates have a positive impact on the car prices that is, when inflation rates are high, the car prices tend to go high too.
Regression analysis was carried out to ascertain the significance of the correlation coefficients and identify the effect of each predictor variable on the response variable. From the model, it was clear that the impact of gross domestic product, inflation rate, and interest rates had a significant impact on the average car prices, while the effect of unemployment rates lacked a substantial impact on the car prices. The model also was adequate for modeling due to the high R-squared value of 96.9%. Further analysis should be carried out to determine other economic indicators that significantly impact the average car prices, which could improve the research and help educate the world on how economic indicators play a part in the prices of cars.
References
Islam, R., Ghani, A. B. A., Kusuma, B., & Hong, E. T. Y. (2016). An analysis of factors that affect the number of car sales in Malaysia. International Review of Management and Marketing, 6(4), 872-882.
Nawi, A. S., Ahmad, B. S., Mahmood, W., Nurathirah, S., & Hamid, B. A. (2013). Determinants of passenger car sales in Malaysia. World Applied Sciences Journal, 23(23), 67-73.
Pilinkus, D., & Boguslauskas, V. (2009). The short-run relationship between stock market prices and macroeconomic variables in Lithuania: an application of the impulse response function. Inžinerinė ekonomika, (5), 26-34.
Rasheed, R., Ishaq, M. N., & Malik, F. (2022). Identification and evaluation of decisive factors in the growth of the automobile industry of Pakistan. iRASD Journal of Economics, 4(3), 394-399.
Vychytilová, J., Pavelková, D., Pham, H., & Urbánek, T. (2019). Macroeconomic factors explaining stock volatility: multi-country empirical evidence from the auto industry. Economic research-Ekonomska istraživanja, 32(1), 3327-3341.
 write
write