Introduction
Valuing a company’s financial position and asset values is vital for business owners and stakeholders and often occurs in different scenarios. For instance, the valuation helps stakeholders understand the organization’s current state and opportunities. This knowledge helps them plan for changes, growth, development, or eventual transition. Company valuation is also essential for business owners or partners preparing for a merger and acquisition deal. In this case, a valuation is a valuable tool in showing the business’s value in its entire life cycle. Therefore, valuation will be determined based on the purpose of the company to merge or acquire. Here, valuation will be done based on market, income, and assets since these approaches provide different valuation techniques that serve the purpose of the merger and acquisition. Lastly, valuation is also performed when a company decides to establish partner ownership with other companies in the same industry. This scenario mainly occurs when the company feels that a partnership will increase its lease of expertise, knowledge, and resources to reach a larger market and manufacture more quality products. Therefore, valuation for partnership would help skyrocket the business to greater heights and better profit margins.
The main objective of this research paper is to carry out a business valuation of the PLC Diageo company. The valuation will help understand where the business stands in its industry landscape and advise the management on better ways to remain competitive in its operations. Notably, this analysis will employ a business valuation model to determine the company’s current and future economic value. The valuation will be detailed and helpful enough in understanding PLC Diageo’s capital structure, market value, and future earnings prospects. The analysis will employ the discounted cash flow approach when valuing the company as a going concern. This will help determine the business’s economic value and give stakeholders an estimated value of the company. Consequently, knowing the company’s current worth gives an in-depth understanding of the company’s future earnings. Before carrying out the valuation, below is a brief overview of the PLC Diageo company.
Diageo plc is a multinational company that produces and distributes alcoholic beverages worldwide. It began in 1886, and since its launch, the company has remained committed to offering its global consumers quality and satisfactory beverage products. This U.K. international liquor firm has its headquarters in London and currently operates in more than 180 countries. The major countries of operation include Latin America, Turkey, North America, Africa, Europe, Asia Pacific, and the Caribbean. By early 2017, PLC Diageo ranked as the largest liquor distiller globally. However, by April 2017, it was soon overtaken by Kweichow Moutai, which performed better and generated higher profit margins. Currently, the company works in liaison with its subsidiaries to produce, market, and sell different alcoholic beverage brands worldwide. Notably, Diageo manufactures its alcoholic and beverage products under popular brand names like Johnnie Walker, Smirnoff, Buchanan’s whiskies, Crown Royal, Guinness, Captain Morgan, Vodka, Bulleit, Cîroc, Casamigos, Tanqueray, Baileys, Don Julio tequilas, and DeLeon brands.
Theoretical and Contextual Literature Review
Financial statements are the primary sources of information when valuing a company to assess its current value. These tools build a picture of the business’s financial situation, thus helping external and internal users make solid decisions in the company. Janiszewski (2011) states that financial statements allow three main methods of valuation (1) Discounted Cash Flow Model, (2) the Dividend Discount Model, and (3) the Comparables Method. However, this literature review will emphasize the DCF method of valuing companies. Therefore, this section will review the practical and theoretical explanations scholars have found on the discounted cash flow (DCF) valuation method. The review reveals that DCF is a powerful tool for evaluating companies, especially in complex scenarios. We also discover that the valuation approach is prone to enormous assumption bias. As a result, any slight modifications in the underlying assumptions drastically affect the valuation conclusions.
Verginis and Taylor (2004) conducted a questionnaire survey of hotel valuation stakeholders to examine the applicability of DCF values. According to the data, most respondents agreed that the DCF approach was the most appropriate way of valuing companies. However, there were indications that the suggested practice of applying supporting valuation methodologies was not followed or understood broadly. Furthermore, a significant minority of respondents believed that the DCF approach was only appropriate for assets operating at higher market levels.
Demirakos et al. (2004) used a structured approach to explain financial analyst valuation methods by looking at the valuation methodology in analysts’ reports from multinational investment banks for U.K. listed businesses. The authors conducted a descriptive analysis to understand participants’ (financial analysts) knowledge of various valuation models. They proposed and evaluated multiple hypotheses on how analyst valuation procedures differ systematically across industries. The findings revealed that: (1) comparative valuation is more common in the beverages sector; (2) analysts typically choose an explicit multiperiod DCF valuation model as their dominant valuation model; and (3) very few analysts use the price to cash flow as a valuation model. These findings agree with that of Demirakos et al. (2010). The study outcomes were vital in educating upcoming financial analysts on different appraisal procedures. The study’s findings also gave valuable insights for future research to examine a broader collection of valuation ideas.
Cooper and Nyborg (2006) discussed different corporate valuation approaches, including adjusted present value, discounting operational free cash flow, discounting equity-free cash flow, and discounting capital cash flow at the unlevered capital cost. The authors look at four different leverage policy assumptions and how they affect discount rates and the present value of tax savings. They explain how to pick between several ways of consistently applying the valuation methodologies and choosing amongst them. Cooper and Nyborg (2006) further show that misusing the DCF valuation model might result in small but significant inaccuracies. They conclude that using improper calculations leads to an estimate of the present value of the tax savings that is twice as high as it should be.
Jacob and Allen (2007) state different DCF approaches when valuing a company. In their attempt to reconcile the different DCF approaches, the authors propose four main methods when valuing a company using discounted cash flows: (1) capital cash flows, (2) adjusted present value, 3) free cash flows, and (4) cash flows to equity. They prove considerable discrepancies in the valuation literature since it links a specific technique to one particular debt rebalancing policy. The authors show how to adapt each valuation methodology for a company that rebalances its debt and adjusts them to account for leverage. All valuation methodologies produce equal outcomes when the debt rebalancing policy is applied consistently. Therefore, Jacob and Allen (2007) prove in their study that when a company rebalances its debt, all valuation methods give the same value. They show how to adapt the four valuation methodologies in reaction to a change in leverage to attain similar values, giving unique company valuation strategies. The authors further give this reconciliation to show that once the debt is rebalanced, any of the four approaches can be used to assess a company’s worth, and the results will be similar. Instead of providing a discount rate comparison, they create a valuation framework for each approach. Using this approach, they reconcile valuation methodologies based on the firm’s debt level and debt-to-value ratio.
Thomas O’Brien (2003) created a simple and adaptable DCF valuation technique in his research. This formula was based on an equity valuation method. It allows gradually falling NPVs of future growth opportunities at a constant rate using the Modigliani-Miller free cash flow model (Thomas O’Brien, 2003). The model considers the fundamental factors of a company’s expected future earnings stream, such as the next period’s planned investment outlay, the projected growth rate of future investment outlays, and the rate of gradual convergence of future investment outlay ROEs the cost of equity (Stubelj, 2010, p.23) The method may be beneficial when companies foresee diminishing projected profits growth, negative near-term free cash flows, or negative near-term earnings. Thomas O’Brien (2003) deems the formula simple since the predicted growth rate of future investment outlays and the expected convergence of their ROEs remain constant. This assumption eliminates the need to estimate a “continuing value” at a future date.
According to Saha and Malkiel (2012), the standard DCF model used to evaluate assets explicitly estimates cash flows for an initial set of years and then assumes that the cash flows would continue to rise at a steady pace indefinitely. The authors address the consequences for valuation and the discount rate when the DCF model’s essential assumption about the presence of an unending stream of cash flows is abandoned or modified in their article. It is fair to presume that cash flows have a non-zero chance of stopping during the valuation term in many valuation contexts. This assumption would help evaluate distressed assets with significant default risk. The authors show that allowing for even a tiny chance that the cash flows may cease to exist at any point in time necessitates a much higher discount rate when calculating the present value of the projected cash flow streams. They also note that small biotechnology businesses, startup initiatives, individual projects, and hedge funds within a company are all valued differently. Therefore, they conclude that the discount rate is a critical input in any DCF valuation model.
Methodology
Data Collection
This study will use a descriptive quantitative research approach to gather and evaluate secondary data from PLC Diageo’s financial statements. Descriptive research design is a highly recommended technique for generating quantitative data that can be assessed quantitatively using inferential analysis (Akhtar, 2016). The quantitative data was obtained from Kaggle – an online community that provides valuable, free-to-download data. The data is preliminary and has its variables derived from PLC Diego’s financial statements.
Variables
The data has multiple variables, but those of interest in this study are six; Free Cash Flow, Cost of Capital (COC), Required Levels of Reinvestment, Operating Profit, Horizon Period, and Return on Invested Capital (ROIC). The FCF variable represents the cash Diageo earns after accounting for cash outflows to sustain its operations. In other words, this FCF is the money left over after PLC Diageo has paid for its capital and operational expenses. The COC variable represents the cost of borrowing money to provide and maintain assets for sanitation, water, or hygiene services. The sum also includes interest paid on borrowed funds and any equity returns to the system’s owners.
The operating profit variable indicates the profit generated by PLC Diageo from its business activities. The horizon period refers to the time between investments made and when needed. The time frames in this data will differ based on the investment aim and investment time (long, medium, or short). The compounding power is greater when the time horizon is longer. Finally, the ROIC variable will evaluate PLC Diageo’s efficiency in allocating resources to lucrative initiatives. In other words, ROIC measures how well LC Diageo uses its capital assets to generate more profit.
Analysis Model
Various statistical approaches were used in the analysis, which was done using the IBM SPSS software. The SPSS program was appropriate for the research because it could create descriptive statistics, carry out complex statistical analyses, and form graphical visualizations like charts, line graphs, and pie charts. The mean and standard deviations for the variables were conducted using descriptive statistics. Notably, the mean value gave a rough idea of the central value in the dataset, while the standard deviation showed the spread of the values in the dataset.
The study also employed correlation between the dependent and independent variables to determine their association. Hauke and Kossowski (2011, p.87) explain three correlation analysis methods applicable in research studies. These include Pearson product-moment correlation, autocorrelation, and Spearman correlation (Hauke correlation & Kossowski, 2011, p.87). Of the three correlation analysis methods, this study employed the Pearson correlation to determine the association between the number of employees in Unilever versus the company’s performance/value over the 2012-2021 period. This correlation approach also helped the researcher understand the strength of the correlation between the number of employees and the firm value. Unlike autocorrelation and spearman’s correlation, Pearson’s correlation helped identify the degree and extent of the correlation (Dhakal, Maag, & Gunasekera, 2020). The analysis will finally employ the DCF model to estimate the company’s present value based on its stream of cash flows.
Data Analysis and Results
A descriptive analysis was carried out on the following variables; year, operating profit, Free cash flow, and reinvestment. The results were as shown in table 1 below. The table notes that the data was spread over 6 years (from years 1 to 6). This time frame helps determine how far the analysis can reasonably predict the future. The 6 years timeframe is useful enough to predict the future value of PLC Diageo. The descriptive statistics table also shows that the mean value of the operating profit is 157.70 M (€) and a standard deviation of 5.84. The minimum operating profit value is 150.00 M (€), and the maximum is 165.61 M (€).
Table 1: Descriptive Statistics
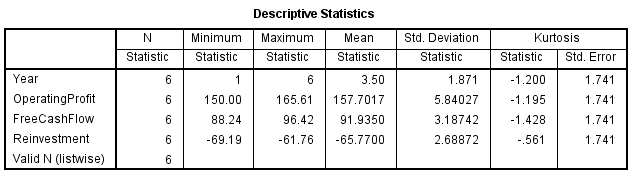
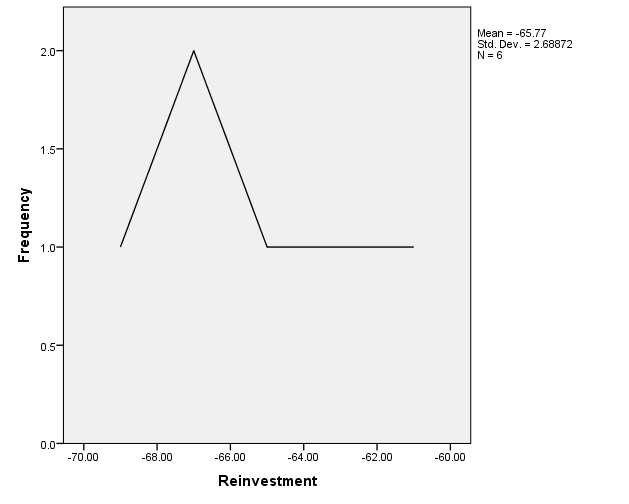
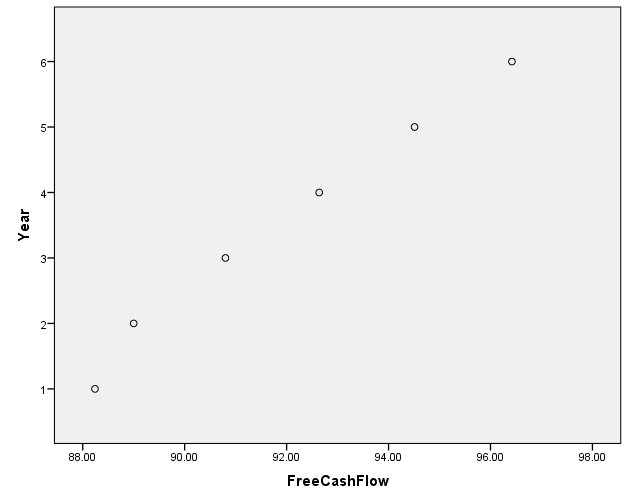
From table 1 above, we also note that the mean value of the free cash flow is 91.94 M (€) and a standard deviation of 3.19. The minimum free cash flow is 88.24 M (€), and the maximum is 96.42 M (€). The table also shows that the reinvestment value of PLC Diageo over the 6-year-period is -65.70 M (€) and a standard deviation of 2.69. The minimum free cash flow is -69.19 M (€), and the maximum is -61.76 M (€).
Table 2: Descriptive Statistics
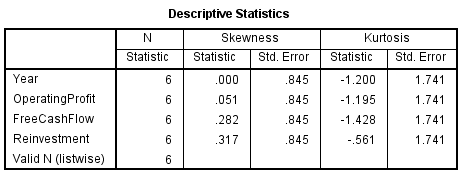
Table 2 above is a descriptive statistic of the skewness and kurtosis values of the variables. From this table, we note that all the three variables (Operating profit, free cash flow, and reinvestment) are positively skewed, as shown in the boxplots shown in figure 1 below. The positive Skewness implies that the tail of the variables is longer than the right side. Therefore, the median and the mean are greater than the calculated mode.
Figure 1: Boxplots of Operating profit, free cash flow, and reinvestment
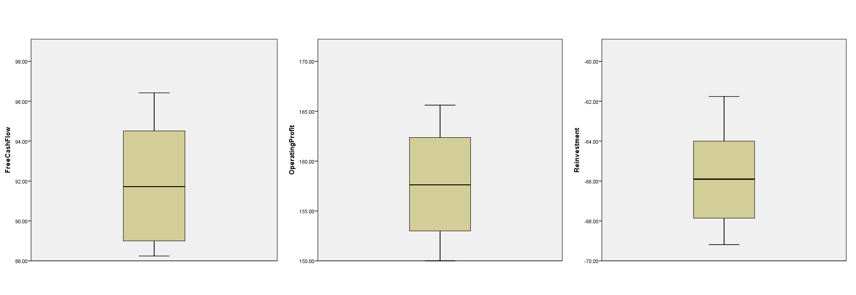
Table 2 above also shows that all the three variables have a negative kurtosis value; Operating profit = -1.195, free cash flow = -1.428, and reinvestment = -0.561. These statistics indicate that the distribution of the variables has lighter tails than the normal distribution.
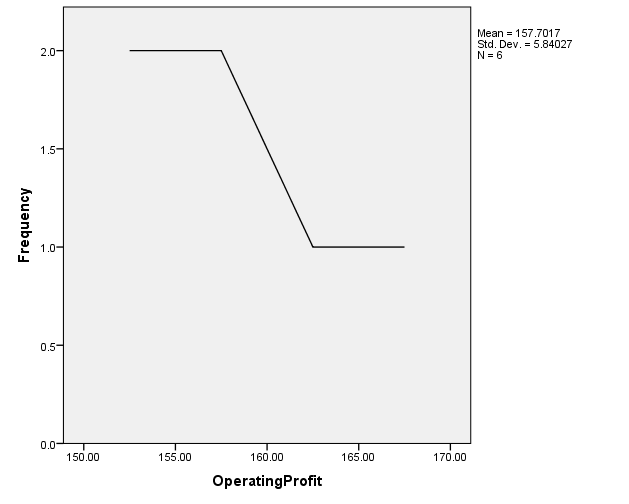
Figures 2 and 3 above show the line graph of the operating profit and reinvestment variables, respectively. We note that PLC Diageo has been experiencing drastic changes in its operating profit and reinvestment value. For instance, the operating profit began at a high rate in year 1, but the profits reduced drastically between years 2 and 5. By the end of year 6, the operating profit was almost constant. The same changes can be seen with the reinvestment value. We note that the reinvestment value increased between years 1 to 3 and then decreased drastically. However, by the end of year 3, the reinvestment value remained almost constant for the next 3 years.
We note a different move in the free cash flow value, as shown in figure 4 below. The figure demonstrates that the free cash flow of PLC Diageo has constantly been increasing over the 6 years. We can conclude that the company has a healthy financial standing and is in an excellent position to pay down its debt and dividends. Furthermore, PLC Diageo can also contribute to growth, attracting more investors to invest in the company.
The study carried out a correlation analysis to understand the relationship between the three variables. The results are as tabulated in Table 3 below.
Table 3: Correlation Matrix
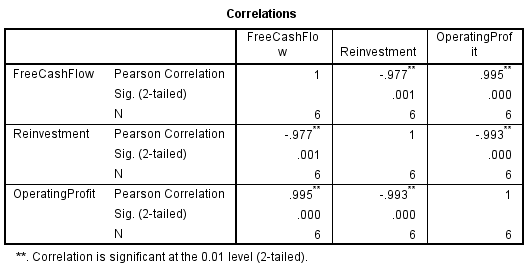
Table 3 illustrates a two-tailed correlation at the 0.01 alpha level. A negative correlation exists between the reinvestment and operating profit variable (-0.993) and the free cash flow and reinvestment (-0.997). These statistics imply that the operating profit decreases as the reinvestment value increases. At the same time, as the reinvestment increases, the company’s free cash flow significantly decreases. On the other hand, with a two-tailed correlation at the 0.01 alpha level, a positive correlation exists between the free cash flow and operating profit variables (0.995) and operating profit and free cash flow (0.995). These statistics imply that the operating profit increases as the free cash flow increases. As the operating profit increases, the free cash flow also increases.
DCF Model Estimation
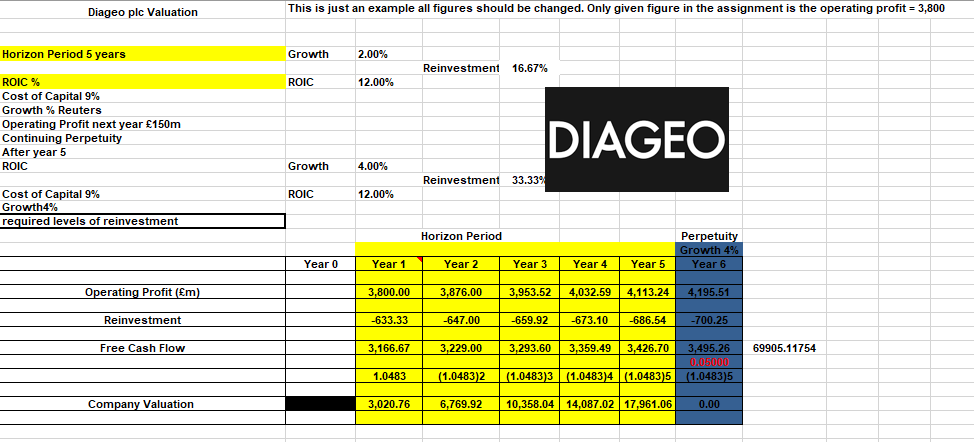
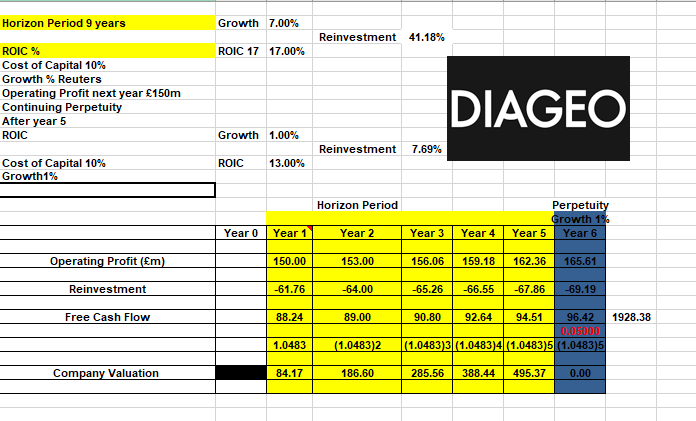
Excel tables 1, 2, 3, and 4 below are the four different inputs in the valuation model. Comparing the results in excel table 4 below with the company’s 2021 Annual revenue report shows similar results. Excel table 4 shows a € 17 B value that ranges within the company’s 2021 revenue level (Annual Report, 2022). The model used a 2-year horizon period (5, 7, & 9 years) which was handy in predicting the company’s future value and making informed decisions. The wide differences in the years also meant that the recent decisions did not affect the optimal decisions in the initial periods. From the excel tables 1, 2, 3, and 4 above, we can see that if the market pushes the horizon period short enough, investors will believe that Diageo Plc could earn above its cost of capital for the next seven years and will be willing to buy the stock. We also note two forecast decisions from the chosen horizons; a short-range forecast and a medium-range forecast.
Excel Table 1: Valuation Model – input 1
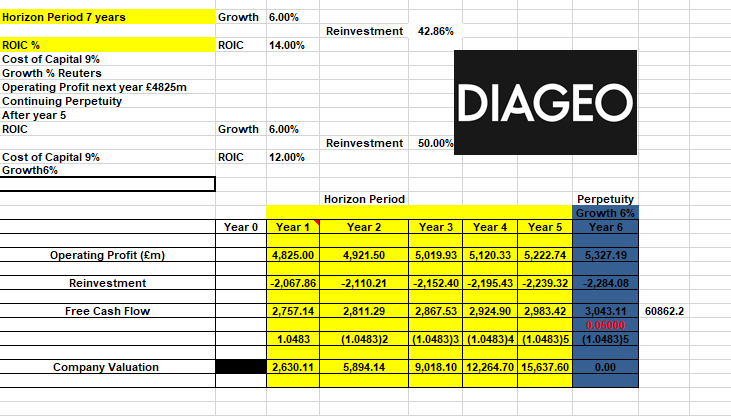
Excel Table 2: Valuation model – input 2
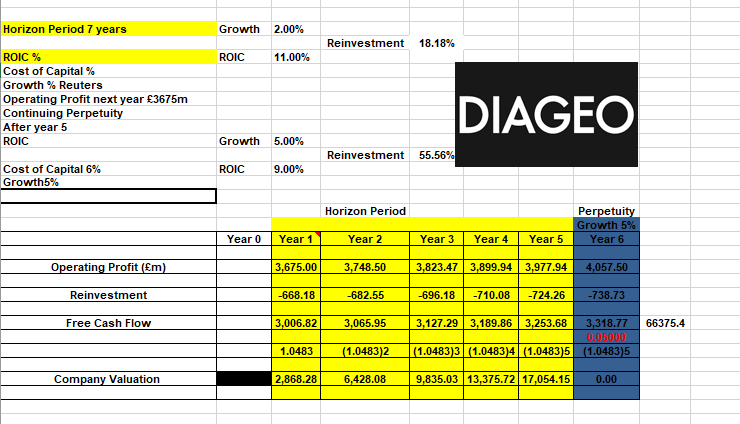
Excel tables 3 and 4 show the short-horizon forecast, while figure 2 shows the medium-horizon forecast. From excel table 2, we see a notable decrease in the company’s expected value, and this information can be used for cash budgeting and sales or production planning. This prediction period could give Diageo’s management a more comprehensive decision-making insight than the short-range horizon forecast. Excel tables 3 and 4 show a short-range forecast horizon. The information could help the management plan short-course decisions like workforce levels, job assignments, and job schedules.
Excel table 1 above shows that Diageo’s ROIC had a higher level than its cost of capital before the horizon period. This data signifies that the company has grown steadily over the years and currently has a stable business model. Surprisingly, Excel tables 2, 3, and 4 also show a similar trend (ROIC > COC). Even in the near future, the company has very high chances of continual growth and productivity due to its healthy business model. We can calculate Diageo’s expected future growth using the operating profit margin metric. During the horizon period (excel table 1), we note a positive growth in the operating profit margin (2% increase). Similar results can be seen after the horizon period (excel tables 2, 3, and 4), which shows a rapidly increasing operating profit margin. We can conclude that the company has a bright and prosperous future ahead.
Excel Table 3: Valuation model – input 3
Excel Table 4: Valuation model – input 4
Conclusion
Traditional valuation approaches like the discounted cash flow model are theoretically similar; therefore, they should provide the same conclusion when the same inputs are applied. They do not, though. This study proposes an alternate valuation approach that offers the required adjustments to generate consistent findings since these methods focus on various value drivers. This research also suggests a new corporate valuation technique (referred to as “financial and economic value-added,” or “FEVA”) that combines the EVA, DCF, and MM methodologies and allows for a complete examination of financial and economic corporate value drivers.
A DCF valuation model uses accurate figures and is more quantifiable than other valuation approaches. It is a more valuable tool for sensitivity analysis since it estimates numbers without considering market sentiment. Financial analysts may also use the model to see how changes in an investment’s assumptions affect the model’s final value. A fixed discount rate for investment or cash flow growth are examples of changeable assumptions. The model considers the time value of money when calculating a company’s earnings over its economic life.
Furthermore, DCF analysis enables analysis to examine the financial standing of firms at a consistent value. The most significant aspect of discounted cash flow is comparing completely different investments. While specialist tools can assist you in doing a discounted cash flow analysis, the study can be performed using an Excel spreadsheet. The independence of this model analysis is handy for corporate executives deciding whether or not to merge with other firms. Another significant advantage of the model analysis is that it is a helpful tool when a business needs to calculate its internal ROR based on the current assets and investments. With such a tool, its management can understand its competitors’ worth and know where to gain a competitive advantage.
One common disadvantage of the DCF model is that the uncertainties from cash flow projections tend to grow year by year during the forecast period. Since DCF mainly uses the 5 – 10 year range estimate, the likelihood of cash flows having uncertainities is high. Even though analysts may adequately assess the operational cash flow of the current and the following years, their ability to forecast earnings and cash flow drops significantly after that. In worst-case scenarios, the cash flows of some years rely on the previous year’s estimates. Unfortunately, the assumptions made last year when modelling the cash flows increase the variances in the operating cash flow projections.
Excel table 3 depicts the first input of the valuation analysis, which revealed a positive risk-free rate. This rate is a positive indicator that indicates the minimum return that investors will expect from their investment in the firm, knowing that they will not take an additional risk unless the prospective rate of return exceeds the risk-free rate. As a result, we may infer that Diageo Plc has a favourable risk-free rate, indicating that the firm has a greater WACC and a growing debt cost. We also note that in excel tables 1, 2, 3, and 4 above, the risk premium is equivalent to the projected return and lesser than the return on a risk-free investment. For instance, in excel table 1 above, its expected return is 10%, and its growth rate is 6%. Therefore, since the company’s investment is 10% and the risk-free rate is 2%, the risk premium will be 4%. This percentage shows the total amount of money investors expect to make if the company experiences a significant risk.
References
Akhtar, D.M.I., 2016. Research design. Research Design (February 1, 2016).
Cooper, I.A. and Nyborg, K.G., 2006. Consistent methods of valuing companies by DCF: Methods and assumptions. Available at SSRN 925186.
Demirakos, E.G., Strong, N.C. and Walker, M., 2004. What valuation models do analysts use?. Accounting horizons, 18(4), pp.221-240.
Demirakos, E.G., Strong, N.C. and Walker, M., 2010. Does valuation model choice affect target price accuracy?. European Accounting Review, 19(1), pp.35-72.
Dhakal, B.P., Maag, A. and Gunasekera, N., 2020, November. Using Machine Learning to Forecast Time Series in Spacecrafts. In 2020 5th International Conference on Innovative Technologies in Intelligent Systems and Industrial Applications (CITISIA) (pp. 1-8). IEEE.
Hauke, J. and Kossowski, T., 2011. Comparison of values of Pearson’s and Spearman’s correlation coefficients on the same sets of data. Quaestiones geographicae, 30(2), p.87.
Janiszewski, S., 2011. How to perform discounted cash flow valuation?. Foundations of management, 3(1), p.81.
O’Brien, T.J., 2003. A simple and flexible DCF valuation formula. Available at SSRN 253448.
Oded, J. and Michel, A., 2007. Reconciling DCF valuation methodologies. Journal of Applied Finance, 17(2), p.21.
Saha, A. and Malkiel, B.G., 2012. DCF Valuation with cash flow cessation risk. Journal of Applied Finance (Formerly Financial Practice and Education), 22(1).
Verginis, C.S. and Taylor, J.S., 2004. Stakeholders’ perceptions of the DCF method in hotel valuations. Property Management.
Stubelj, I., 2010. Valuation of Slovene publicly traded companies with a valuation model based on expected earnings and growth opportunities. Managing Global Transitions, 8(1), p.23.
 write
write