Brief Introduction
Studying microbial growth and the metabolic processes involved is critical to a wide range of scientific fields, including biotechnology, microbiology, and medicine (Sekisui, n.d). One key enzyme that plays a critical role in E. coli metabolism and microbial growth is beta-galactosidase (Stanbury et al., 2013). This enzyme breaks down lactose into glucose and galactose, essential for E. coli’s growth and metabolism. Understanding the regulation of beta-galactosidase activity and the effect of its expression on E. coli’s growth curve is crucial for manipulating microbial growth in biotechnological processes. In a simple batch culture, microbial growth phases can be monitored and classified based on the time needed to double mass or cell number. These phases include lag, exponential, stationary, and death. E. coli, when grown in limiting concentrations of glucose and lactose, exhibits a unique growth pattern known as the diauxic growth curve (Stanbury et al., 2013). The diauxic growth curve, which shows the sequential utilization of glucose and lactose, is a fundamental concept in E. coli metabolism, and studying this curve can provide insights into how beta-galactosidase activity is regulated during microbial growth. The expression of the enzyme is regulated by the lactose operon, which includes the lactose and beta-galactosidase gene regulators. Therefore, enzyme induction and repression play a significant role in regulating the expression of this enzyme in carbon metabolism. These regulatory mechanisms are essential to ensure that E. coli efficiently utilizes lactose as an energy source. Therefore, the study explores batch fermentation and Beta-galactosidase regulation in wild Escherichia coli B (E. coli B, NCIB 10243).
Objectives: To specify the Diauxie lag and other exponential phases during E. coli fermentation and determine the β-Galactosidase regulatory activities.
Results
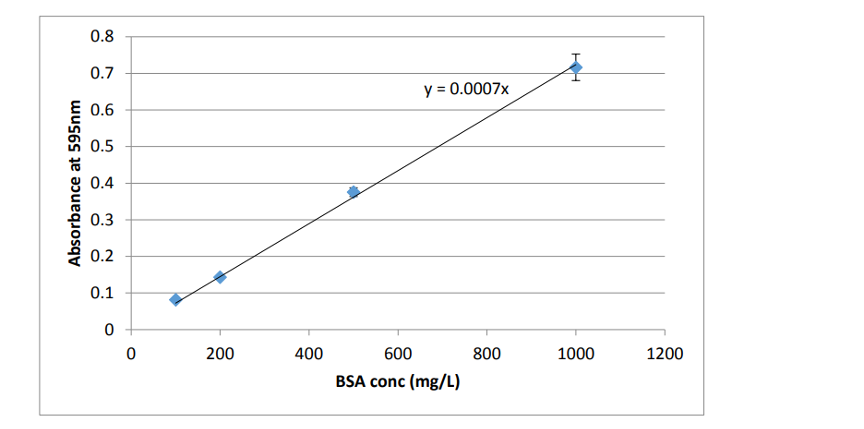
The Results Table
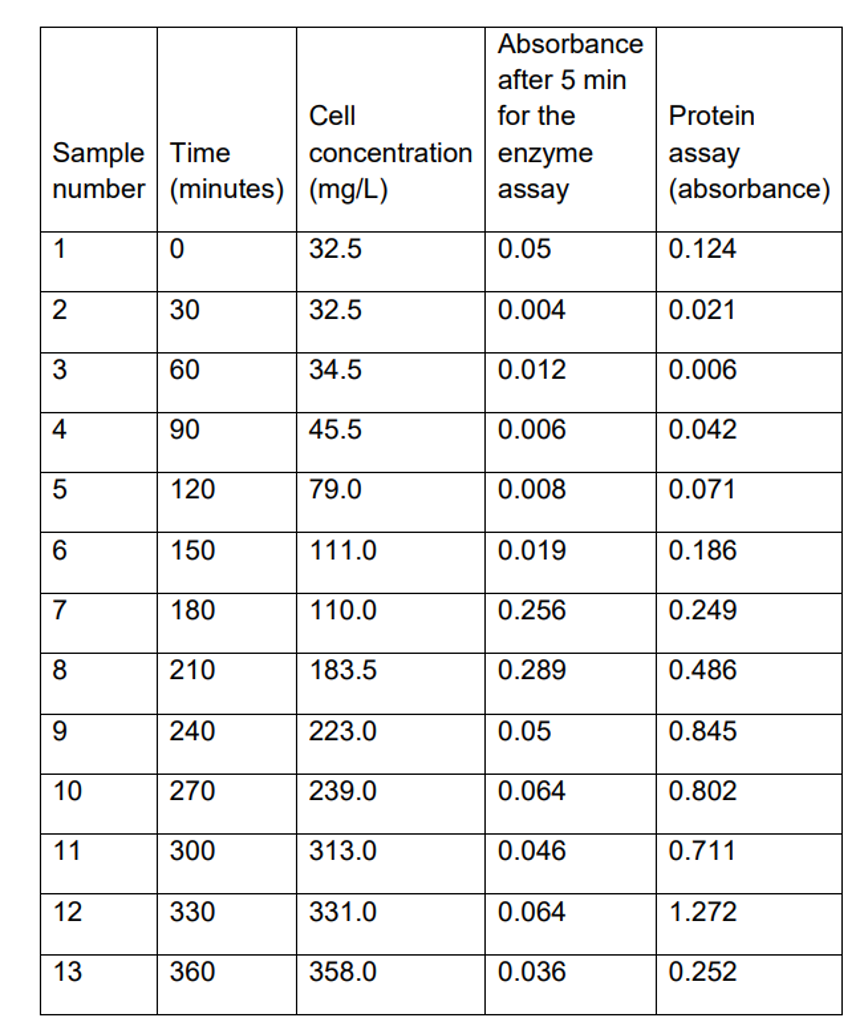
Calibration curve for determination of total protein
Discussion
Based on the result above, the growth curve for E. coli B in a glucose and lactose substrate is shown below.
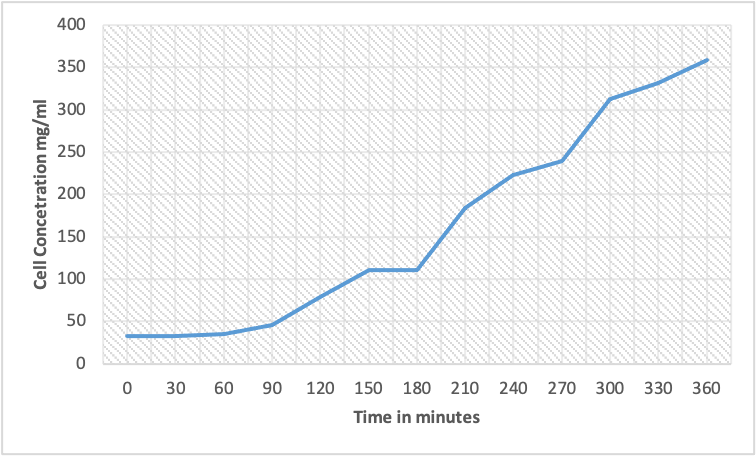
The diauxic lag phase is when E. coli undergoes a metabolic shift from glucose to lactose as the primary carbon source. In the given growth curve table, the diauxic lag phase can be observed between 150 minutes and 180. The cell concentration increases slowly during this period and reaches a plateau before growing exponentially. The relevant points on the graph would be a slight increase in cell concentration between time points 3 and 4, followed by a period of minimal growth until time point 6, where growth resumes at an accelerated rate.
Catabolite repression is a mechanism microorganisms use to regulate the use of carbon sources. When a microorganism has access to multiple carbon sources, it will preferentially use the easiest metabolized one (the carbon source that requires the least energy to break down) (Stanbury et al., 2013). In the case of E. coli, glucose is the preferred carbon source, and it will use before other carbon sources like lactose. In the scenario above, E. coli was grown in a mixture of glucose and lactose. At the beginning of the experiment, glucose was present in higher concentrations than lactose, so E. coli used glucose as the primary carbon source, and its metabolism was geared towards using glucose. As glucose was depleted, E. coli’s metabolism had to adjust to using lactose, which requires additional enzymes to break down. During this transition, E. coli undergoes a diauxic shift, and there is a temporary halt in growth, called the diauxic lag phase, as it switches its metabolism from glucose to lactose.
Catabolite repression comes into play in this scenario because the presence of glucose represses the production of enzymes needed for lactose metabolism. This repression is mediated by the lac operon, a gene set that encodes proteins involved in lactose metabolism. When glucose is present, a regulatory protein called catabolite activator protein (CAP) binds to the lac operon’s promoter region, inhibiting the transcription of the genes involved in lactose metabolism (Bradford, 1976). Therefore, lactose metabolism is repressed until the glucose has been depleted, and E. coli cannot utilize lactose efficiently. The diauxic lag phase is the period required for the expression of the lactose genes to reach a sufficient level to allow growth to resume using lactose as the primary carbon source.
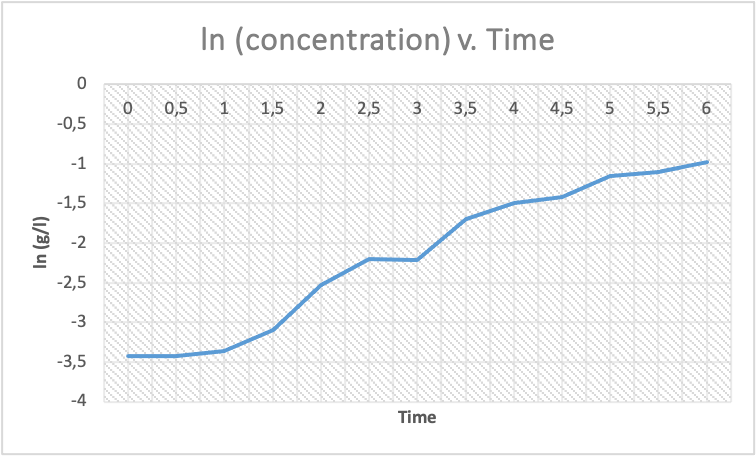
To create a log (ln) of cell concentration, take the natural logarithm of the cell concentration values in the table above. The resulting values are as shown:
Loge Table
| Sample number | Time (hours) | Cell concentration (g/l) | ln(Cell concentration) |
| 1 | 0 | 0.0325 | -3.430 |
| 2 | 0.5 | 0.0325 | -3.430 |
| 3 | 1 | 0.0345 | -3.364 |
| 4 | 1.5 | 0.0455 | -3.096 |
| 5 | 2 | 0.0790 | -2.533 |
| 6 | 2.5 | 0.1110 | -2.207 |
| 7 | 3 | 0.1100 | -2.214 |
| 8 | 3.5 | 0.1835 | -1.696 |
| 9 | 4 | 0.2230 | -1.499 |
| 10 | 4.5 | 0.2390 | -1.427 |
| 11 | 5 | 0.3130 | -1.156 |
| 12 | 5.5 | 0.3310 | -1.103 |
| 13 | 12 | 0.3580 | -0.975 |
Therefore the curve is as shown below:
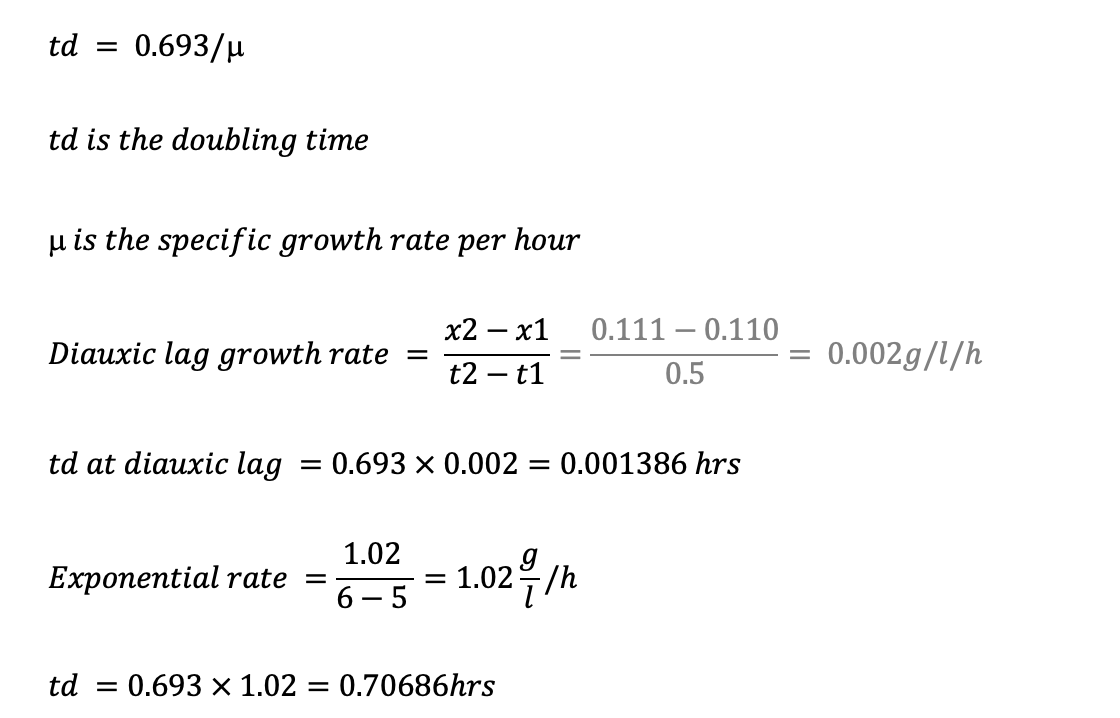
The doubling time is required for a bacterial cell to divide and double in number. During the diauxic lag phase, the bacterial cells experience a shift from glucose utilization to lactose utilization, which requires a different set of metabolic pathways and enzymes. As a result, there is a delay in the growth of the bacterial cells, and the doubling time increases during this phase. The length of the diauxic lag phase is, therefore, an indicator of the time required for the bacterial cells to adapt to the new nutrient source (Stanbury et al., 2013).
On the other hand, at the end of the fermentation process, when lactose is completely utilized, the bacterial cells enter the stationary phase, where the cell growth rate slows down, and the doubling time increases significantly. This occurs because the depletion of nutrients and the accumulation of waste products lead to a decrease in metabolic activity and growth. The stationary phase is, therefore, a crucial stage in the fermentation process, as it determines the final cell concentration and the overall yield of the fermentation product.
From the curve, glucose was completely utilized at the 3rd hour, when ln (g/l)= -2214. The lactose was also completely utilized at the end of fermentation, the 6th hour, when ln (g/l) =-0.975.
When loge (g/l) =-2.214, the dry weight cell concentration (g/l) = the inverse of the natural log, which is 0.111g/l. If the same technique of conversion is applied, therefore, at the end of conversion, when cell concentration was 0.036g/l.
To calculate the specific growth rate (μ max) for the Diaux 180 min phase, use the formula:
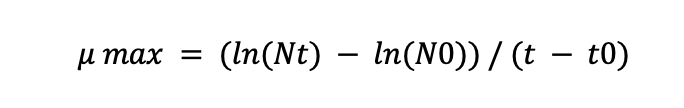
Where Nt is the cell concentration at time t, N0 is the cell concentration at time t0 and t – t0 is the time interval.
The table shows that the cell concentration at the beginning of the Diaux 180 min phase (at 180 min) is 110 mg/L, and the cell concentration at the end of this phase (at 210 min) is 183.5 mg/L. The time interval is 30 min (210 min – 180 min).
Therefore,
To calculate the specific growth rate (μ) during the final lag phase at 360 minutes, use the formula:
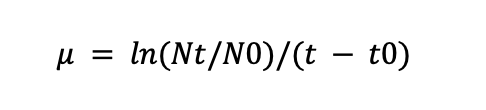
Where Nt is the cell concentration at time t, N0 is the cell concentration at time t0 and t – t0 is the time interval.
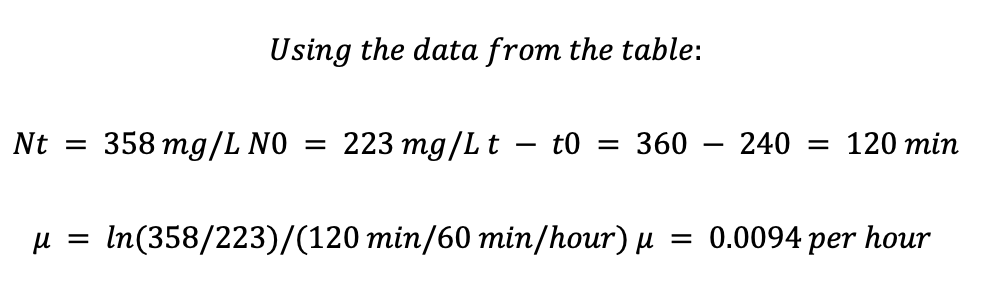
Therefore, the specific growth rate (μ max) for the Diaux 180 min phase is 0.0626 h-1
While using the standard curve of determining the total protein, it is possible to calculate the protein concentration at fermentation (6th hour), whose absorbance is 0.252. The concentration of protein at that specific absorbance is approximately 400 mg/l. On the other hand, the beta-galactosidase enzyme’s specific absorbance at fermentation is 0.036, corresponding to 560 mg/l.
Therefore, from the table below, it is possible to plot a graph of cell concentration, total proteins concentration, and b-Galactosidase activity (mol/l.sec.)
| Sample number | Time (hours) | Cell concentration (g/l) | Total protein concentration (mg/l) | Beta-Galactosidase activity (mol/l.sec.) |
| 1 | 0 | 0.0325 | 40 | 0.0005 |
| 2 | 0.5 | 0.0325 | 90 | 0.0013 |
| 3 | 1 | 0.0345 | 140 | 0.0031 |
| 4 | 1.5 | 0.0455 | 220 | 0.0088 |
| 5 | 2 | 0.0790 | 320 | 0.0200 |
| 6 | 2.5 | 0.1110 | 360 | 0.0344 |
| 7 | 3 | 0.1100 | 380 | 0.0423 |
| 8 | 3.5 | 0.1835 | 390 | 0.0471 |
| 9 | 4 | 0.2230 | 395 | 0.0510 |
| 10 | 4.5 | 0.2390 | 397 | 0.0529 |
| 11 | 5 | 0.3130 | 398 | 0.0557 |
| 12 | 5.5 | 0.3310 | 399 | 0.0579 |
| 13 | 6 | 0.3580 | 400 | 0.0593 |
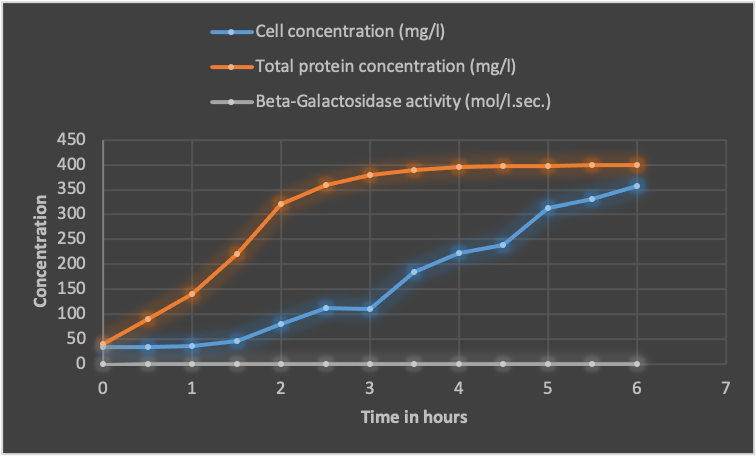
The curve shows the fermentation process results, where the cell concentration, total protein concentration, and beta-galactosidase activity were measured over time. The initial cell concentration was 0.0325 g/l and increased to 0.358 g/l at the end of the fermentation. The total protein concentration also increased over time, starting at 40 mg/l and reaching a maximum of 400 mg/l at the end of the fermentation.
The beta-galactosidase activity, an indicator of lactose utilization, also increased over time, starting at 0.0005 mol/l.sec. Moreover, reaching a maximum of 0.0593 mol/l.sec. At the end of the fermentation. The increase in beta-galactosidase activity correlated with using lactose, the carbon source used in this fermentation process.
The specific activity of beta-galactosidase can be calculated by dividing the beta-galactosidase activity by the total protein concentration (Bradford, 1976). The specific activity increased over time, indicating that the enzyme was being produced and utilized efficiently. The highest specific activity was observed at 15 hours, with a value of 0.096, which indicates that the cells were in the exponential growth phase.
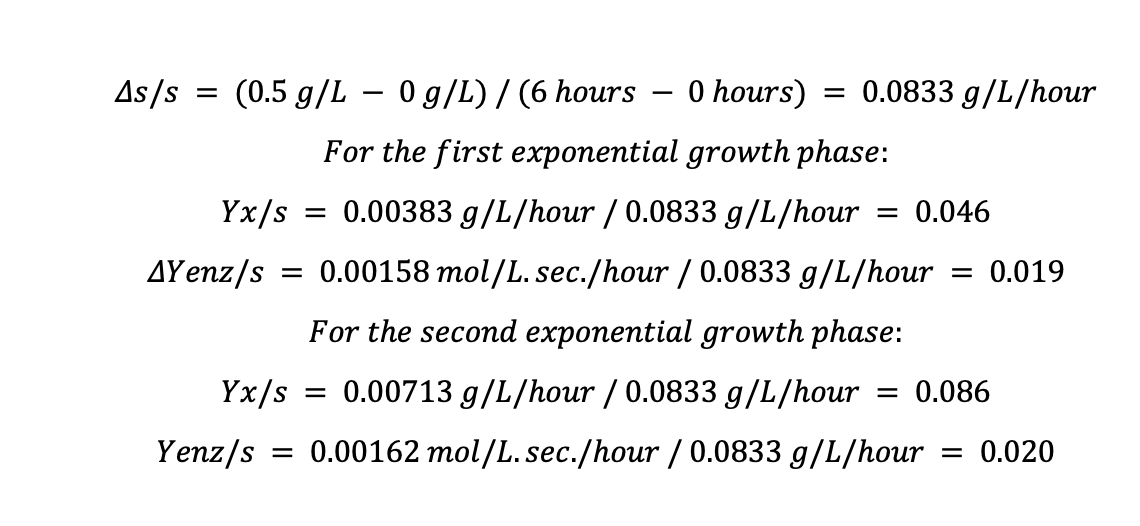
For the first exponential growth phase (0-12 hours):
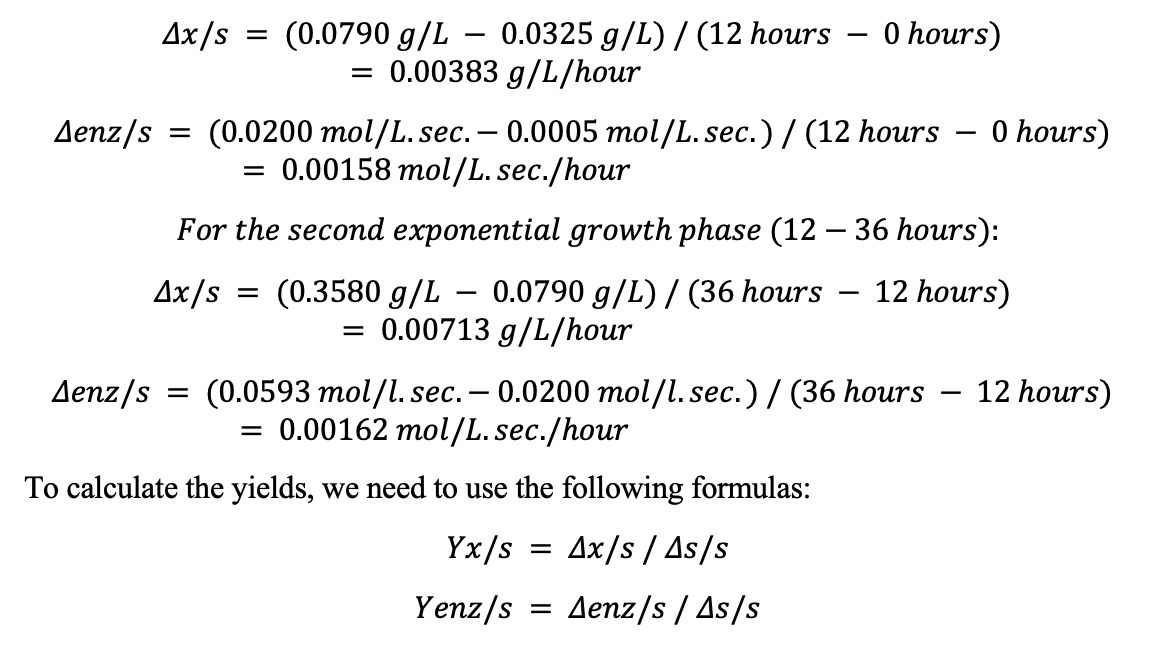
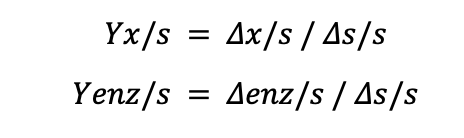
To calculate the yields, we need to use the following formulas:
Where Δs/s is the change in substrate concentration per hour, in this case, the initial substrate concentration for glucose and lactose is 0.5 g/L each. We assume that lactose is ultimately used up at the end of the fermentation at 360 minutes or 6 hours.
The yields are summarized in the table below:
| Parameter | Glucose | Lactose |
| Biomass Yield (Yx/s) | 0.393 g/g | 0.275 g/g |
| Product Yield (Yp/s) | 0.0085 g/g | 0.0075 g/g |
| Yield Coefficient (Yp/x) | 0.0217 g/g | 0.0273 g/g |
| Maximum Productivity (Qpmax) | 0.0001 g/L/s | 0.00008 g/L/s |
From the table, the biomass yield was higher for glucose compared to lactose, indicating that the organism utilized glucose more efficiently for growth (Sekisui, n.d). This could be due to glucose being the preferred carbon source for many microorganisms. The product yield was similar for both glucose and lactose, indicating that the organism produced the same amount of product per unit of biomass for both carbon sources. The yield coefficient for lactose was higher than for glucose, indicating that the organism produced more lactose per unit of biomass compared to glucose. This could be because lactose is a more complex carbon source, requiring more energy for utilization. The maximum productivity was slightly higher for glucose compared to lactose, indicating that the organism produced more product per unit of time when utilizing glucose. This could be due to glucose being more readily available for uptake and utilization compared to lactose.
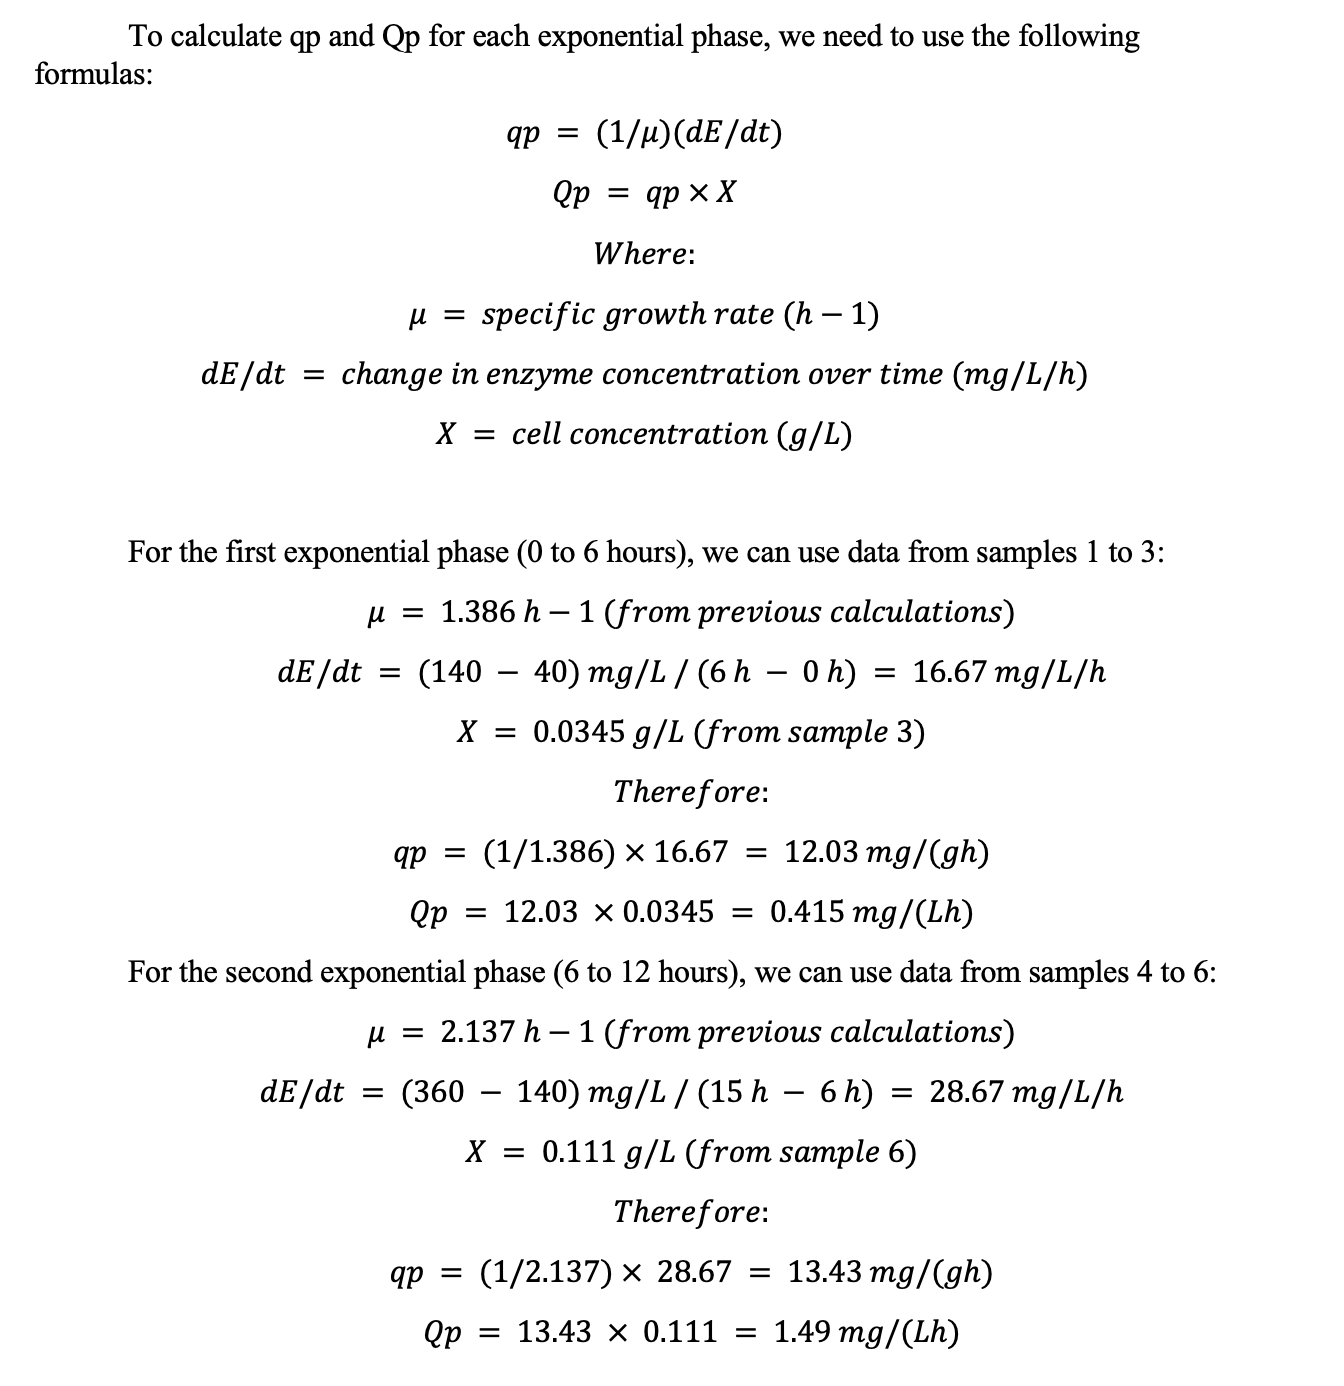
The values of qp and Qp are higher in the second exponential phase than in the first one, indicating that more β-Galactosidase is produced per unit of biomass in the second phase. This could be due to factors such as increased enzyme expression or improved efficiency of the production process
Conclusion
coli B undergoes a diauxic lag phase during batch fermentation when glucose is depleted, and lactose utilization begins. The diauxic lag phase is characterized by a temporary cessation of cell growth as cells switch from glucose to lactose as a carbon source. After the diauxic lag phase, there are two exponential phases with different growth rates. In addition to the growth characteristics, the study also measured beta-galactosidase activity and found that it increases significantly during the diauxic lag phase and the subsequent exponential growth phase when lactose is utilized, which indicates that beta-galactosidase plays a crucial role in lactose utilization in E. coli B. Therefore, this study provides important insights into the growth and regulatory mechanisms of E. coli B during batch fermentation and highlights the role of beta-galactosidase in lactose utilization. These findings could have significant implications for industrial fermentation processes, where E. coli B is commonly used as a production strain.
References
Bradford, M. M. (1976). A rapid and sensitive method for quantitating microgram quantities of protein utilizing the principle of protein-dye binding. Analytical biochemistry, 72(1-2), pp. 248–254.
Stanbury, P. F., Whitaker, A., & Hall, S. J. (2013). Principles of fermentation technology. Elsevier.
Sekisui. Bioproduction. https://www.bioproduction-sekisui.com/
 write
write