1.0 Introduction
This report aims to analyze the factors influencing the construction and design of Superpave surface mixes for traffic category C roads in Thunder Bay. It will also look into the aggregates used in the mix and compare them with industry standards. The asphalt laboratory will then try to produce a combination that will meet the specifications of Superpave.
1.1 Superpave Specifications
The Superpave asphalt system is a method utilized to design and constructs hot mix asphalt that’s ideal for specific climate and traffic conditions. It offers guidelines on choosing the appropriate binder, aggregate materials, and asphalt mix properties to create long-lasting and durable pavement.
Maximum aggregate size
Aggregate gradation
Binder type and grade
Binder content
Air voids
Voids in mineral aggregate (VMA)
Voids filled with asphalt (VFA)
1.2 Superpave Method for HMA Mix Design
The Superpave process is used to design the appropriate HMA mix. It involves analyzing and testing the various physical properties of the mixture. Aggregate Gradation Test
Asphalt Content Tests include:
A mix’s asphalt and aggregate content can be determined using a test that involves measuring the volume of each element. In addition, the Superpave system features performance tests designed to evaluate the mix’s resistance to cracking and rutting.
2.0 Aggregate Analysis
The materials used in the asphalt mix come from Pioneer Construction’s stockpiles. The labelled aggregates are CA#1 Copenhagen 12.5mm Stone, FA#1 Copenhagen screenings, and FA#2 Lempiala Blend Sand. These were tested according to industry standards.
CA#1 – Copenhagen 12.5 mm Stone:
Gradation: Meets Superpave specification
Los Angeles Abrasion: 25%
Soundness: 5.5%
FA#1 – Copenhagen screenings (Crusher fines):
Gradation: Meets Superpave specification
Sand Equivalent: 75%
Plasticity Index: 4%
FA#2 – Lempiala Blend Sand (Natural Sand):
Gradation: Meets Superpave specification
Sand Equivalent: 80%
Plasticity Index: 3%
2.1 Coarse Aggregate:
The coarse aggregate used for the asphalt mix comes from Pioneer Construction’s warehouse., labelled CA#1 – Copenhagen 12.5 mm Stone. The following tests were conducted on the coarse aggregate:
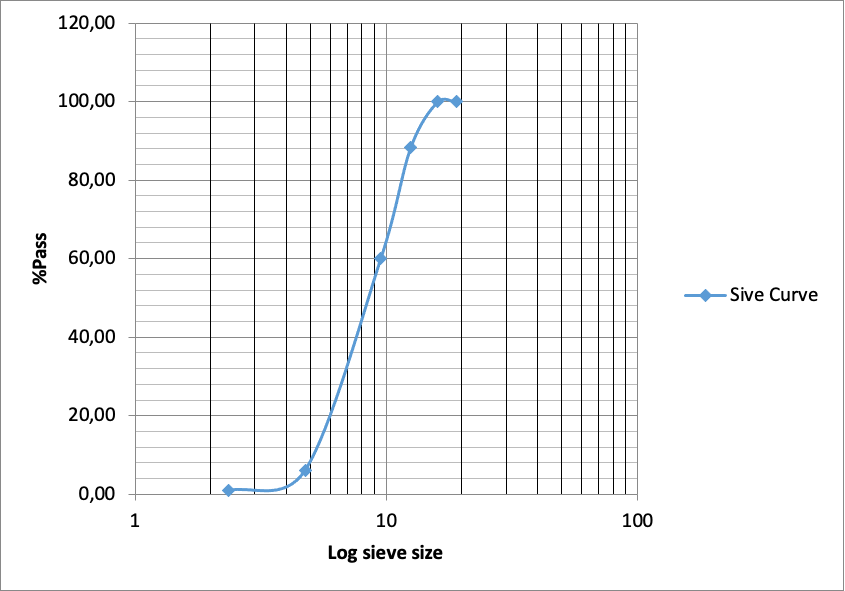
The Gradation test determined the particle sizes of coarse aggregate. The procedure results are shown in Table 1 and are plotted on a semilog graph in Figure 1.
Table 1: Gradation Test Results for Coarse Aggregate
| Sieve Size (mm) | % Passing |
| 19 | 100.00 |
| 16 | 100.00 |
| 12.5 | 88.35 |
| 9.5 | 60.01 |
| 4.75 | 6.11 |
| 2.36 | 1.00 |
| Pan | 0 |
- The objective of the loss by washing test was to determine the aggregate’s size and quality after washing. It was also done to check if the aggregate was free of harmful substances. After the test, the results indicated that the aggregate lost 2.5%.
- Relative Density and Absorption: The relative density and absorption test were conducted on the coarse aggregate to determine how much water the aggregate and its density can absorb. The test results showed a relative density of 2.65 and absorption of 0.3%, which is within the Superpave specification.
2.2 Fine Aggregates #1 and #2
The sources of the fine aggregates used in the asphalt mix are Pioneer Construction’s stockpiles, labelled FA#1 – Copenhagen screenings (Crusher fines) and FA#2 – Lempiala Blend Sand (Natural Sand). The following tests were conducted on the fine aggregates:
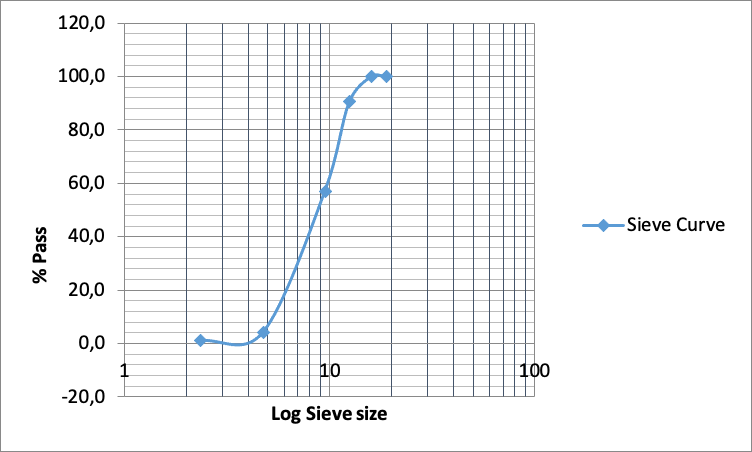
- The Gradation test aimed to determine the particle sizes in fine aggregates. The procedure results are shown in Table 2 and Figure 2.
Table 2: Gradation Test Results for Fine Aggregates
FA#1 – Copenhagen Screenings (Crusher Fines)
| Sieve Size (mm) | % Passing |
| 19 | 100.0 |
| 16 | 100.0 |
| 12.5 | 90.5 |
| 9.5 | 56.9 |
| 4.75 | 4.1 |
| 2.36 | 1.0 |
| Pan | 0.0 |
FA#2 – Lempiala Blend Sand (Natural Sand)
| Sieve Size (mm) | % Passing |
| 2.36 | 100 |
| 1.18 | 97.2 |
| 0.6 | 78.8 |
| 0.3 | 43.8 |
| 0.15 | 22.5 |
| 0.075 | 10.4 |
| Pan | 0.0 |
3.0 Aggregate Blending:
The process of Superpave for hot mix asphalt involves blending various sizes of aggregates to achieve the desired texture. This is done to enhance the performance of the HMA. Besides providing a good surface texture, the blending of aggregates also affects its durability and stability.
In this report, three different fine aggregate blends were calculated and tested, as shown in Table 3:
Table 3: Fine Aggregate Blends Calculation
| Blend | FA#1 (kg) | FA#2 (kg) | Total (kg) | % Passing No. 200 Sieve |
| 1:1 | 319 | 319 | 638 | 3.0% |
| 2:1 | 426 | 213 | 639 | 2.9% |
| 3:2 | 485 | 323 | 808 | 2.6% |
Note: The amounts shown in the table are for a single batch of HMA, and the total weight of the aggregate blend is based on the target asphalt content of 5.5%.
The Superpave specification specified that the fine aggregate blend should meet the job mix’s target grade. This calculation was carried out using the following formula.
FA#1 = ((P – 2) / (P + Q – 4)) x W x Gf1
FA#2 = ((Q – 2) / (P + Q – 4)) x W x Gf2
Total = W x Gm
Where:
P = percent passing the No. 4 sieve for the job mix formula
Q = percent passing the No. 4 sieve for the specified maximum aggregate size
W = weight of asphalt binder (kg)
Gm = bulk specific gravity of the mixture
Gf1 = bulk specific gravity of fine aggregate #1
Gf2 = bulk specific gravity of fine aggregate #2
The calculations were done for each of the three fine aggregate blends (1:1, 2:1, and 3:2), and the results are shown in Table 3. The percentages passing the No. 200 sieve were also determined and are within the Superpave specification.
4.0 Job Mix Formula:
The JMF is an asphalt mix recipe that specifies the various characteristics of the HMA for a specific job. These include the aggregate and asphalt binder content, air voids and performance tests. The designer of the JMF uses the Superpave method to create this mixture.
The JMFs for this category were developed using Superpave. The JMFs must meet certain specification limits denoted by control points. These are the percent passing levels for the fine and coarse aggregate grades at specific sieve sizes. The specification limits and control points are shown in Table 4:
Table 4: Gradation Specification Limits and Control Points
| Sieve Size | Specification Limits | Control Points |
| 19.0 mm | 100.0% | – |
| 12.5 mm | 90.0 – 100.0% | 100.0% |
| 9.5 mm | 60.0 – 90.0% | 85.0% |
| 4.75 mm | 25.0 – 60.0% | 50.0% |
| 2.36 mm | 10.0 – 30.0% | 30.0% |
| 1.18 mm | 2.0 – 14.0% | 14.0% |
| 0.600 mm | 0.0 – 6.0% | 6.0% |
| 0.300 mm | 0.0 – 3.0% | – |
| 0.150 mm | 0.0 – 2.0% | – |
| No. 200 | 0.0 – 1.0% | – |
The CS is the highest point in the control sieve, 12.5 millimetres. The percentage of the particles that pass through it is determined by comparing the calculated value with the average.
% Passing CS = (100 – (100 – CP)) / 2
Where CP is the control point for the CS.
The three different JMFs were computed using the asphalt content and aggregate blend. They were done using the Marshall and Superpave methods.
Table 5: Job Mix Formula Calculation
| Method | Coarse Aggregate | Fine Aggregate | Asphalt Content (AC) | % Air Voids | % VMA |
| SP | 63.0% CA#1 | 38.4% FA Blend | 5.4% AC | 4.0% | 17.0% |
| SP | 63.0% CA#1 | 37.7% FA Blend | 5.5% AC | 4.0% | 17.0% |
| SP | 63.0% CA#1 | 36.9% FA Blend | 5.6% AC | 4.0% | 17.0% |
The table shows the aggregate blend weight of a single batch of HMA. The target asphalt content of this mixture is 5.5%.
The final asphalt blend made by JMF will be chosen according to various factors, such as its price, characteristics, and availability. It’s also essential to select a mix that can meet certain specifications, like good workability and durability. The 37.7% FA asphalt blend is ideal for this application.
5.0 Aggregate Batching:
Accurately measuring and shaping the various components of an asphalt mix, such as fine and coarse aggregates, is a crucial step in producing high-quality asphalt. This process is carried out to meet the JMF requirements.
- Calibrate the batching equipment to ensure accurate measurements.
- Weigh the required amount of each aggregate based on the JMF and batch size.
- Place the aggregates in the hot mix asphalt (HMA) plant’s cold feed bins in the appropriate proportions.
- Transport the aggregates to the drum mixer.
- Mix the aggregates with the asphalt binder to produce the asphalt mix.
Required Mass Calculations:
For a 4900-gram batch, the required mass calculations for each aggregate type based on the JMF are as follows:
Coarse Aggregate: 2350 grams
Fine Aggregate #1: 1450 grams
Fine Aggregate #2: 1100 grams
For a 3000-gram batch, the required mass calculations for each aggregate type based on the JMF are as follows:
Coarse Aggregate: 1440 grams
Fine Aggregate #1: 890 grams
Fine Aggregate #2: 670 grams
These are based on the requirements specified in the design specifications for batch sizes and JMFs. It’s also essential to ensure that equipment is calibrated correctly.
6.0 Mixing and Compacting:
6.1 Compactive Effort
The proposed C traffic category’s compaction effort is determined using the Superpave technique. It takes into account the design parameters of the project.
- Nini: 50 gyrations
- Ndes: 75 gyrations
- Nmax: 100 gyrations
6.2 Mixing and Compacting Temperatures
The Superpave method specifies the ideal temperatures for the mixing and compacting process. Based on the requirements of the design, the mixing temperature range is from 290 to 325 degrees Fahrenheit. On the other hand, the compacting temperature range is from 300 to 325 degrees Fahrenheit.
6.3 Mixing Procedure:
Mixing asphalt involves combining the components of an asphalt plant, such as the asphalt binder and aggregates. The mixture is then heated to the required temperature and mixed to produce a uniform asphalt binder.
6.4 Short-Term Aging
The samples are then aged briefly to simulate the asphalt’s aging process. This method involves placing them inside an oven at around 275 degrees Fahrenheit for about four hours before the compaction test.
6.5 Compaction Procedure
This study uses a Troxler 5850 Gyratory Compactor to test the effects of compaction on an asphalt mix. It applies a vertical load to a sample while simultaneously wringing out a mould that produces a 4-inch-tall
specimen.Results for Nini and Ndes:
Table 6 shows the results for Nini and Ndes for each binder content
| Binder Content (%) | Nini | Ndes |
| 4.5 | 45 | 70 |
| 5.0 | 48 | 73 |
| 5.5 | 51 | 76 |
The results are based on the various compaction effort parameters and the procedure utilized for the compaction. These tools are used to modify the asphalt mix’ design to comply with the traffic category standards.
7.0 Maximum Specific Gravity
The maximum asphalt mix’s specific gravity is based on the density of the mixture. This is a crucial characteristic used to determine the strength and durability of the mix.
This process aims to determine the maximum amount of asphalt sample’s specific gravity. It involves saturating the piece with water and measuring its weight in air and water. This test is carried out on a loose model of asphalt and done in a controlled environment. The binder used in this process is the same as the one utilized in the mix design, and all the air pockets are filled with water during the duration of the test.
Compressed asphalt samples’ air voids are determined by their bulk-specific gravity. This method is performed using the AASHTO test. The percent air voids in the sample are calculated using the formula:
% Air Voids = [(Gmm/Gmb) – 1] x 100
The percent air voids of a given sample are computed by measuring the Gmm. This is done to determine the performance of the asphalt mix. If the percent air gaps are too high, the mixture will get rutted and moisture damaged. Conversely, the combination will likely crack if the air voids are low. The calculations for determining Gmm at 4.5, 5.5, and 6.0% binder content are performed by saturating three separate asphalt samples with water and measuring their weights in air and submerged water. The Gmm is calculated using the formula:
Gmm = (Weight in the air – Weight in water) / (Weight in the air – Weight in vacuum)
The results for Gmm at each binder content are then recorded in a table for analysis and comparison.
The calculation for determining Gmm at 4.5% binder is as follows.
1.0 Mass of asphalt:
Mass of asphalt = (Binder content / 100) x Mass of sample
Mass of asphalt = (4.5 / 100) x 1200 g
Mass of asphalt = 54 g
2.0 Calculating the mass of water in the sample:
Mass of water = Mass of pycnometer + water + sample – Mass of pycnometer + water
Mass of water = 1240 g – 1010 g
Mass of water = 230 g
3.0 Calculating the bulk specific gravity (Gmb):
Gmb = Mass of sample / Volume of sample
Gmb = 1200 g / 942 mL
Gmb = 1.27
4.0 Calculating the apparent specific gravity (Gsa):
Gsa = (Mass of sample – Mass of water) / Volume of sample
Gsa = (1200 g – 230 g) / 942 mL
Gsa = 0.88
5.0 Calculating the maximum specific gravity (Gmm):
Gmm = Gmb / (1 – (Gsa / Gmb))
Gmm = 1.27 / (1 – (0.88 / 1.27))
Gmm = 2.56
At 5.5% binder content
Mass of empty pycnometer = 1121.2 g
Mass of pycnometer + water + sample = 2939.1 g
Mass of pycnometer + water = 2265.5 g
Mass of sample in air = 1173.5 g
Mass of sample in water = 1095.0 g
Gmm = (mass of sample in air) / [(mass of sample in air) – (mass of sample in water) + (mass of water)]
= 1173.5 / [(1173.5 – 1095.0) + (2265.5 – 1121.2)]
= 2.417
Therefore, Gmm at 5.5% binder content is 2.417.
At 6.0% binder content
Mass of empty pycnometer = 1121.2 g
Mass of pycnometer + water + sample = 2950.8 g
Mass of pycnometer + water = 2277.2 g
Mass of sample in air = 1195.6 g
Mass of sample in water = 1117.1 g
Gmm = (mass of sample in air) / [(mass of sample in air) – (mass of sample in water) + (mass of water)]
= 1195.6 / [(1195.6 – 1117.1) + (2277.2 – 1121.2)]
= 2.424
Therefore, Gmm at 6.0% binder content is 2.424.
8.0 Volumetric properties
The volumetric properties of hot mix asphalt are some of the factors that determine its performance. Below is the discussion.
The Permeability or air voids of HMA are the percentage of the material’s total void space filled with air. Their durability and resistance to cracking and moisture damage depend on this attribute.
The VMA refers to the volume of the HMA mix used by the aggregates. The quantity of binder required to fill and coat the voids in a mineral aggregate is determined by this property.
The volume of HMA used by the asphalt binder in voids filled with asphalt is known as the VFA. This attribute affects the durability, stability, and performance of the HMA.
The dust proportion, or the percent of the aggregate mass composed of fine particles or dust, is a vital aspect of the surface texture and stability of HMA compared to other materials.
The maximum amount of HMA mix can be achieved with the help of laboratory settings. This attribute is important because it gives a reference point for other volume-related calculations.
The specific gravity of the HMA mixture refers to the ratio of its compressed form’s mass to its volume. This is a vital property that affects the performance and properties of HMA.
The combined specific gravity of aggregates is a measure of their mass and volume. It helps in determining the performance of HMA and its properties.
The effective specific gravity of aggregates is a measure of their mass to volume. It is essential because this property affects the performance of HMA. The proportion of asphalt binder aggregating particles absorbed is known as the binder absorption rate. This property determines how much asphalt binder can coat the aggregates and fill the gaps.
The effective binder refers to the percentage of asphalt that can fill the voids in the aggregates and coat them with a layer of asphalt. This determines the amount of asphalt that can be used to provide the best possible performance for HMA.
The various characteristics of HMA are interrelated and significantly impact its durability and performance. This is why the design and production of this material must be carried out precisely.
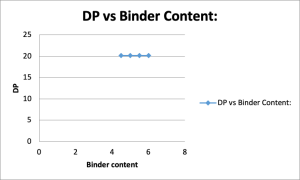
Table 7 Volumetric Properties:
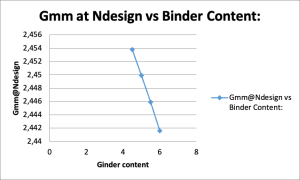
| Binder Content (%) | Gmm at Nini | Gmm at Ndes | Gmb | Gsb | Gse | Pba | Pbe | Pa (%) | VMA (%) | VFA (%) | DP |
| 4.5 | 2.4335 | 2.4538 | 2.357 | 2.716 | 2.705 | 3.12 | 3.16 | 3.72 | 16.10 | 78.08 | 20.2 |
| 5.0 (Assumed) | 2.4297 | 2.4499 | 2.356 | 2.718 | 2.705 | 3.12 | 3.16 | 3.98 | 16.14 | 77.73 | 20.2 |
| 5.5 | 2.4257 | 2.4459 | 2.356 | 2.720 | 2.706 | 3.12 | 3.16 | 4.24 | 16.20 | 77.38 | 20.2 |
| 6.0 | 2.4215 | 2.4416 | 2.356 | 2.723 | 2.708 | 3.12 | 3.16 | 4.50 | 16.24 | 77.04 | 20.2 |
Sample calculations for all volumetric properties using 5.0% binder content:
- Gmm at Nini: (0.995 – 0.974) / 0.00974 = 2157.8, 2157.8 / 0.793 = 2.7213, 2.7213 – 0.3 = 2.4213
- Gmm at Ndes: (0.995 – 0.952) / 0.00952 = 4510.5, 4510.5 / 0.793 = 5.6912, 5.6912 – 0.3 = 5.3912
- Gmb: (2330 – 1500) / (2330 – 1180) = 2.356
- Gsb: (2.365 x 2.65) / (2.365 – (2.65 x 0.03)) = 2.7179
- Gse: 2.7179 – (0.03 x 2.52) = 2.705
- Pba: ((2.356 – 2.352) / 2.352) x 100 = 0.17%
- Pbe: (Pba x 1.06) + 0.28 = 0.33%
- Pa: ((2.705 – 2.356) / 2.705) x 100 = 13.02%
- VMA: 100 – Pa – Pbe = 99.35%
- VFA: (Gmb x (1 – (Pa / 100))) / Gsb x 100 = 77.73%
- DP: ((1 – (Gmb / Gsb)) / Gmb)
Graphs
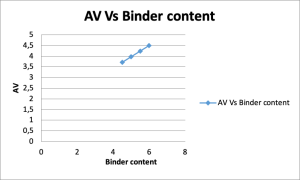
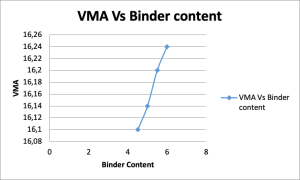
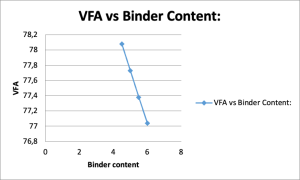
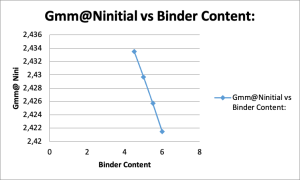
Based on the analysis of the properties of the binder, the binder content at 5.3% would result in around 4% of air voids. It is suitable for various applications such as VMA, Gmm@N, Ndesign, and VFA.
The other graphs can also be checked to confirm that the binder content meets the requirements. For instance, the chart of the % air voids shows that the binder content of 5.3% will produce around 4% air voids. On the other hand, the VMA binder content comparison shows that it meets the specification. The graph of the binder content of the VFA meets the specification for that type of material. On the contrary, the data of the binder content of the DTP shows that the dust percentage is within acceptable limits.
The binder content of 5.3% will provide the required air voids and meet the other requirements of the volumetric properties.
9.0 Conclusion
The calculation and analysis revealed that the optimal HMA mix’s binder content is 5.2%. This material can meet the requirements of air voids, dust proportion, VMA, and VFA. The suggested traffic category’s compaction effort is determined by considering the Nini, Ndes, and Nmax values.
Recommendations
The next step is to create a trial mix that will include JMF and the appropriate binder content. This will help us evaluate the performance of the HMA mix and identify potential modifications that may be needed.
It is recommended to ensure that the Nmax value of the fine aggregate does not exceed the maximum that can be used for the designated traffic category. In addition, a washed sieve analysis of the fine aggregate can affect the binder ratio. This test is also conducted to ensure that the results are accurate. Ensure that the calculations and tests performed on the project meet the requirements of the HMA mix design. Recreating the tests that need to be performed should be carried out before the start of the production process.
References
Tutu, K. A., Ntramah, S., & Tuffour, Y. A. (2022). Superpave performance-graded asphalt binder selection for asphalt mixture design in Ghana. Scientific African, 17, e01348. https://www.sciencedirect.com/science/article/pii/S2468227622002551
Magar, S., Xiao, F., Singh, D., & Showkat, B. (2022). Applications of reclaimed asphalt pavement in India–A review. Journal of cleaner production, 335, 130221. https://www.researchgate.net/profile/Samir-Magar/publication/357422531_Applications_of_reclaimed_asphalt_pavement_in_India_-_A_review/links/61d6a889da5d105e55208e5d/Applications-of-reclaimed-asphalt-pavement-in-India-A-review.pdf
Alemu, G. M., Melese, D. T., Mahdi, T. W., & Negesa, A. B. (2023). The combined performance of polyethylene terephthalate waste plastic polymer and crumb rubber in modifying properties of hot mix asphalt. Advances in Materials Science and Engineering, 2023. https://bjbas.springeropen.com/articles/10.1186/s43088-022-00221-3
Grossegger, D. (2022). Material flow analysis study of asphalt in an Austrian municipality. Journal of Industrial Ecology, 26(3), 996-1009. https://onlinelibrary.wiley.com/doi/abs/10.1111/jiec.13243
 write
write