Demographic data describe specific populations together with their characteristics. The demographic analysis focuses on population-based factors such as sex, race, and age (Bondarenko et al., 2022). Demographic data characterize socioeconomic information, encompassing income, death and birth rates, employment, education, etcetera (Bondarenko et al., 2022). This information is expressed statistically. The study focuses on the demographic data of Lydia Hawk Elementary School.
Data
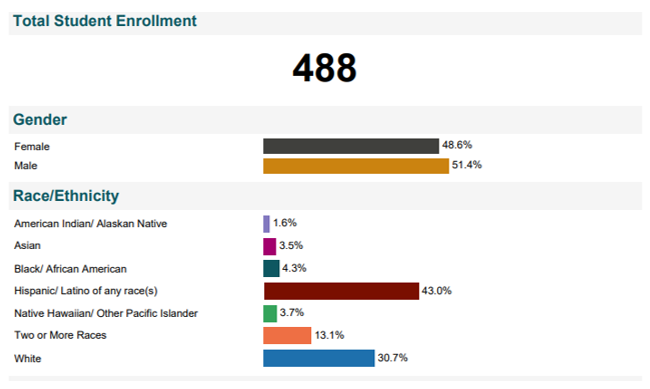
Figure 1: Total enrollment, gender, and race between 2021 and 2022
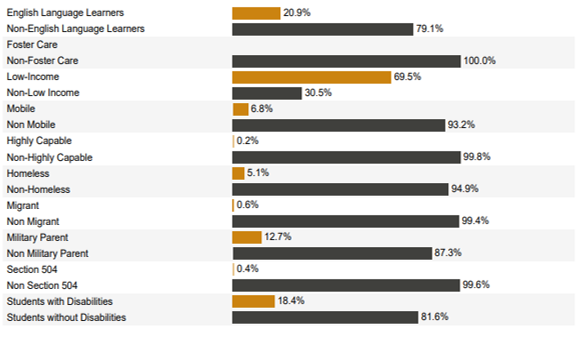
Figure 2: Program and characteristics between 2021 and 2022
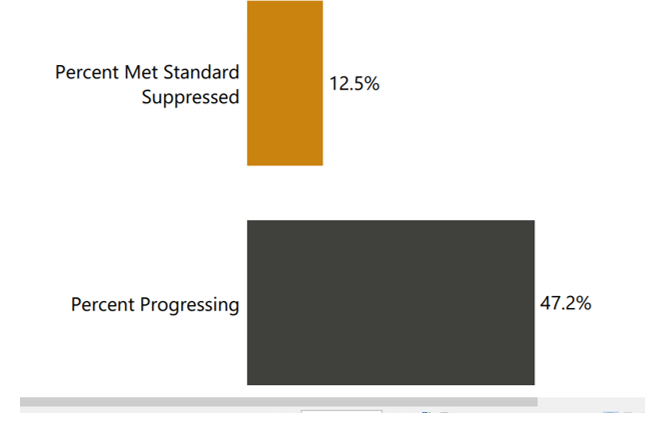
Figure 3: English learner assessment for students enrolled in the program between 2018 and 2019
Observation
A total of four hundred and eighty-eight learners enrolled in Lydia Hawk Elementary School between 2021 and 2022. 48.6% and 51.4% represent the number of males and females, respectively. The majority of the students are Hispanic or Latino. The white students are the second largest students in the institution. The minority of the learners are American Indian or Alaskan Native. Learners of more than one ethnicity represent 13.1% of the total student population. Other Pacific Islander or Native Hawaiian, African American, and Asian students represent 3.7%, 4.3%, and 3.5% of the population of the students.
Figure 2 demonstrates that learners enrolled in the program come from diverse backgrounds. As a result, the program is designed to satisfy the students’ specific needs. For instance, English Language Learners represent 20.9% of the total number of registered students. Furthermore, the learners with disabilities are 18.4%, while students without disabilities are the majority, representing 81.6%. Therefore, from Figure 2, a tutor can analyze the variable of interest to form the basis of taking appropriate measures to assist the students.
Based on Figure 3, 47.2 of students enrolled between 2018 and 2019 progressed into the next step. A learner leaves the program after mastering four English areas: writing, reading, listening and speaking. Typically, a student takes six years to learn these four areas of English. Furthermore, 12.5% did not advance to the next stage.
Importance of the Data
A teacher’s demographic data is critical in many aspects of school. For instance, when planning for a lesson, demographic data assists teachers in coming up with a lesson plan that satisfies the needs of the learners. In Lydia Hawk Elementary School, the demographic data shows the number of learners with disabilities and without disabilities. The majority of the students are without disabilities. Therefore, this data helps the tutor to develop a lesson plan that addresses the needs of both learners with and without disabilities. According to language assessment, the data indicates the number of students who progressed to the next level and those who did not, leading to the proper development teaching plan for the students to enhance their performance in the English language. Knowing the ethnicity of learners is also significant in providing teaching support to learners. Race can reveal the students’ performance on a specific subject. Thus, such data assists tutors in determining factors associated with race and how they influence learners’ performance. Knowing such factor contributes to the development of practical teaching support for learners.
Implementation of Data
In my teaching practices, I will incorporate the data in developing lesson plans that address the needs of all students. For example, I will ensure a group of students, based on their performance, will enable the early finishers to help their peers understand the subject’s content. The students’ race will assist me in identifying ethnic-based factors that influence students’ performance and how to address those factors. Again, the data will aid in determining the number of students I should have in class to enable effective learning.
Conclusion
Demographic data is essential in teaching practices. It informs teachers about appropriate educative measures to ensure learners absorb the lesson content. For instance, at Lydia Hawk Elementary School, demographic data shows the number of students with and without disabilities, making it easier for teachers to plan for them. Furthermore, from the data, the tutor also learns about the number of enrolled learners, which assists in determining the number of students in a specific classroom.
References
Bondarenko, O. V., Hanchuk, O. V., Pakhomova, O. V., Tsutsunashvili, G., & Zagórski, A. (2022). Visualization of demographic statistical data. IOP Conference Series.Earth and Environmental Science, 1049(1), 012076. https://doi.org/10.1088/1755-1315/1049/1/012076
 write
write