Aim
To determine the unknown concentration of sodium hydroxide solution by titration with a known concentration and volume of sulfuric acid.
Hypothesis
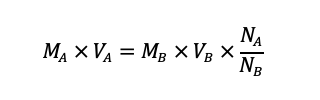
The concentration of sodium hydroxide solution can be calculated from the volume of sulfuric acid required to reach the equivalence point using the balanced chemical equation:
Variables
- Independent variable: volume of sodium hydroxide solution added
- Dependent variable: colour change of phenolphthalein indicator
- Controlled variables: concentration and volume of sulfuric acid, temperature, pressure
Measurement/Observations
The sodium hydroxide solution was added by a burette reading ±0.1cm3. Using a ± 0.01 cm3 uncertainty pipette, the amount of sulfuric acid involved in the mixture was also measured. For the endpoint of this titration, a colour change in a white-coloured tile was noticed where the colourless phenophlethalina indicator turned pink after a reaction of sodium hydroxide and carbonic acid.
Safety
The experiment involved handling corrosive materials, like sulphuric acid, and alkalis, like sodium hydroxide, that could cause burns to the eyes, body, skin, and apparel. Hence, the safety goggles, gloves, and lab coats protected the head, hands, and chest areas. Any contact with the reagents required rinsing the exposed area with ample water, followed by immediate medical attention—disposal of the waste by pouring it into designated containers.
Resources/Materials
- 100 mL conical flask
- 150 mL beaker
- 10 mL pipette (class B)
- Pipette filler
- Filter funnel
- Clamp stand
- 100 mL beaker
- White tile
- Sulfuric acid (10 cm3, 0.01 mol/dm3)
- Sodium hydroxide (unknown concentration)
- Phenolphthalein indicator
- 50 cm3 burette (class B)
Method
A pipette filler was used to draw up some sulfuric acid solution from the 100 mL beaker into the pipette. The pipette was not inserted directly into the stock bottle of acid. 10 cm3 of the acid was transferred into the conical flask. A few drops of phenolphthalein indicator were added to the acid in the flask. The solution was colourless.
The burette was flushed a few times using some sodium hydroxide solution that was later discarded into the waste container. This was followed by filling the burette with sodium hydroxide solution through the filter funnel. The nozzle of the burette was airfree. They then read the burette initially. The conical flask was put on the white tile below the burette. Then, the burette tab was released, and the sodium hydroxide solution drained slowly into the beaker. This caused the solutions to combine, and the flask was then swirled lightly.
When the solution in the flask became light pink, the tap of the burette was closed. Finally, the last reading of the burette was taken, and the sodium hydroxide solution added was measured. This was the approximate titration result.
Subsequently, the process was repeated for the other three precise titrations. The next step involved adding sodium hydroxide drops into the flask until it almost reached the endpoint, at which point deionized water was poured onto the inner walls of the flask using a wash bottle. A pale rose-coloured residual was allowed to remain in the field of vision for at least 15 seconds until it disappeared. For every accurate titration, the volume of the sodium hydroxide solution used was taken down on record, and the mean titer was calculated.
Results
The following table shows the results of the titrations:
| Trial | Initial burette reading (cm3) | Final burette reading (cm3) | Titre of NaOH solution (cm3) |
| Rough | 0.9 | 13.5 | 12.5 |
| 1 | 13.5 | 24.2 | 10.7 |
| 2 | 24.2 | 34.9 | 10.7 |
| 3 | 34.9 | 39.2 | 4.3 |
The average titer of NaOH solution was 10.7 cm3.
Discussion
The concentration of sodium hydroxide solution was calculated using the following formula:
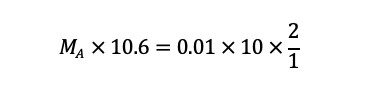
Substituting the values from the experiment, we get:
Solving for MA, we get:
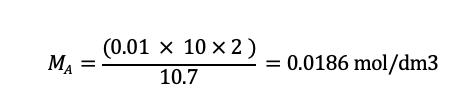
The concentration of sodium hydroxide solution was 0.0186 mol/ dm3.
The errors in this experiment were mainly attributed to the uncertainties in the measuring devices and the judgment based on the endpoint. A class b pipette with a repeatability of ± 0.03 cm3 was employed. Class B – burette with ±0.1cm3 uncertainty was adopted. This depended upon the colour change noted in a solution with phenolphthalein as an indicator for the endpoint, whose intensity is light-dependent and sometimes operator-eye-limited. This might be attributed to a darker pink showing an overshoot for the endpoint and a higher titer of NaOH solution (Blétry, 2019).
The percentage errors due to the uncertainties of the pipette and the burette were calculated as follows:
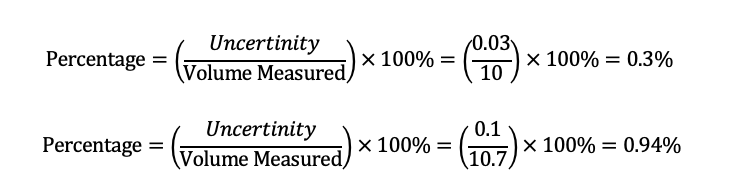
The total percentage error of the experiment was the sum of the percentage errors of the pipette and the burette, which was 1.23%.
Conclusion
The experiment aimed to determine the unknown concentration of sodium hydroxide solution by titration with a known concentration and volume of sulfuric acid. The average titer of NaOH solution was 10.7 cm3. The concentration of NaOH solution was calculated to be 0.0189 mol/dm3. The total percentage error of the experiment was 1.24%.
Evaluation
Some other methods and equipment could make the experiment more accurate and reliable. Hence, for instance, class A glassware contains fewer uncertainties than class B glassware, thereby reducing measurement errors (Blétry, 2019). Another way is to employ a more accurate instrument like a pH meter and universal indicator that can report the final pH of the solution precisely at the endpoint (Wahyuni & Purwanto, 2020).
Bibliography
Blétry, M. (2019) Henderson Hasselbalch relationship and weak acid titration [Preprint]. doi:10.26434/chemrxiv.8256035.v1.
Wahyuni, T.S. and Purwanto, K.K. (2020) ‘Students’ conceptual understanding on acid-base titration and its relationship with drawing skills on a titration curve’, Journal of Physics: Conference Series, 1440(1), p. 012018. doi:10.1088/1742-6596/1440/1/012018.
 write
write