Introduction
The capital analysis clearly analyzes banks following the regulations as stated in Basil II guidelines. The regulations give the bank a minimum value of each ratio through which it must not operate below the provided ratio. Violation of the regulations leads to consequences and even the closure of the banks. The main reason for analyzing the ratios is to understand the financial health of the banks and how it has been operating based on the given regulations. Initially, banks were operating using the 5Cs, which include Character, Cash Flow, Collateral, Conditions, and Covenants, as a form of understanding the business’s creditworthiness, but the introduction of Basil I and II has led to changes in the regulations. This paper covers five ratios from five banks in the United States (Arnianti, 2022). The banks used are among the top ten banks in the United States, and each bank will comprise years ranging from 2013 -2022, which is ten years. Each bank analysis will be presented separately before comparing with other banks before the conclusion.
Citi Group Bank Analysis
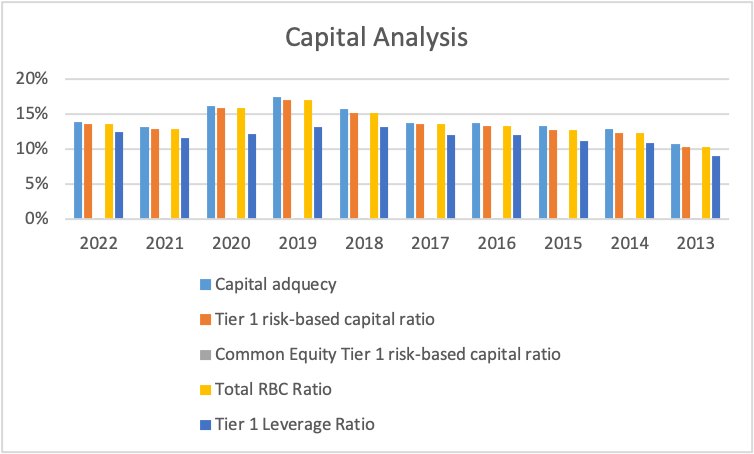
Citi group bank is an international bank operating under the financial institution established in 1998 in New York, United States. The financial capital ratio analysis for the bank covered ten years from 2013 to 2022. The information was obtained from the Microtrends, and five ratios were calculated. The ratios include Capital adequacy, Tier 1 risk-based capital ratio, Common Equity Tier 1 risk-based capital ratio, Total RBC Ratio, and Tier 1 Leverage Ratio. The data was presented in a bar graph to establish the trend, as shown in the below graph.
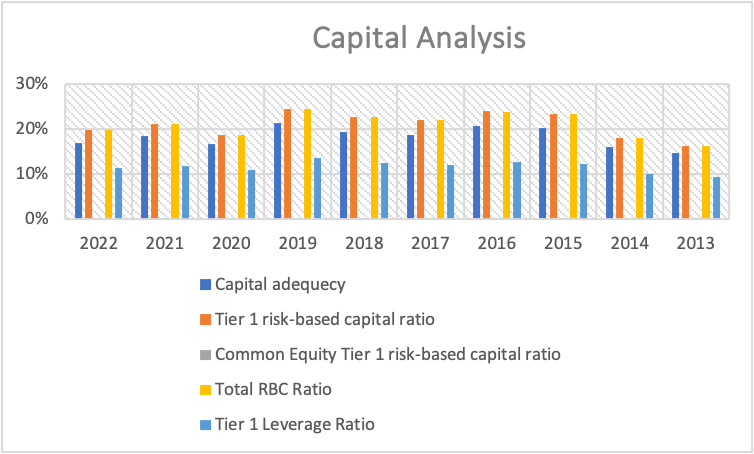
The graph above shows that the capital adequacy ratio for the ten years varied, with 2013 having the lowest ratio of 9% while the others were above 10%. According to Arnianti (2022), a ratio of between 8% is favorable. Therefore the trend showed that the Cite group had a strong ratio for the years 2013 to 2022, which indicated that there was proper bank control and the bank had no possibility of bankruptcy. The capital adequacy ratio is calculated by taking the amount of capital in tier 1 added by the tier 2 capital divided by the risk-weighted assets. Therefore, the trend provides confidence for the bank management to understand the bank’s stability in the economy.
The second ratio was the tier 1 risk-based capital ratio, calculated by dividing the risk of tier 1 capital by risk-weighted assets. The ten years analysis shows that from 2013, all ratios were above 10% but below 30%. According to Oino (2021), banks should maintain a ratio of 3% as the minimum value for effective and efficient operation. The trend shows that 2019 and 2016 had the highest figures compared to the other years. The lowest value was in 2013, indicating that the ratio has been increasing since 2023. The ratio indicates that the bank is in a good position to manage the risks using tier 1 capital. The ratio shows that the bank was liquid and had no bankruptcy risk. This shows that the bank had the adoption of the Basil III regulations that demanded the ability to keep tier I capital to assets at a minimum ratio of 3%.
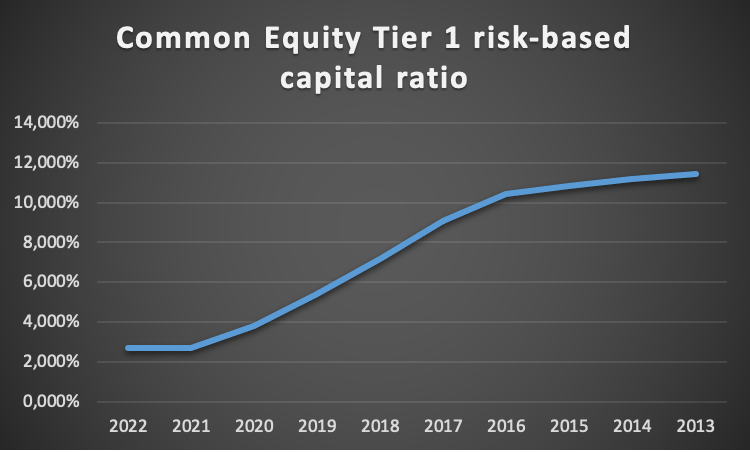
The Common Equity Tier 1 risk-based capital ratio is referred to as the highest regulation of the Basil III regulation since it absorbs all the losses as they occur in the company (Obadire, Moyo & Munzhelele, 2022). The ratio is obtained by dividing all tier 1 and tier 2 capital by risk-weighted assets. (RWA). The Basil regulations give the bank a minimum operation value of 4.5%. At this ratio, banks are required to operate above it. According to the information provided by Citi Group Bank, the bank operated below the required value of 4.5% for ten years. The ratio was less than 1% for the ten years, indicating that the bank failed to absorb all the assets risks when they occurred, which put the bank at risk of being liquidated in case of failing to realize the risk assets amount.
The Total RBC Ratio is calculated as total capital divided by the risk-weighted assets. The amount shows the bank’s efficiency in absorbing all the assets risks from the available capital in the bank. According to Abbas, Ali, and Rubbaniy (2021), the ratio requires a minimum percentage of 8%. According to the analysis, the ratio was above 10% from 2013 to 2022, indicating that the bank had sufficient capital for the ten years. Lastly, the Tier 1 Leverage Ratio shows how the bank was capitalized as per the Basil III regulations. The recommended value by the regulation was 8%. According to the data, the ratio was capitalized from 2013 to 2022; the ratio was above 8%, indicating that the bank operated above the minimum requirement.
Bank of America Analysis
The Bank of America is one of the largest banks in the world, providing international banking and monetary services. The target customers include large organizations, individuals, and small businesses. Five capital ratios were calculated from the financial information obtained from the company and micro trends websites. The trend for the capital ratios is presented in the graph below.
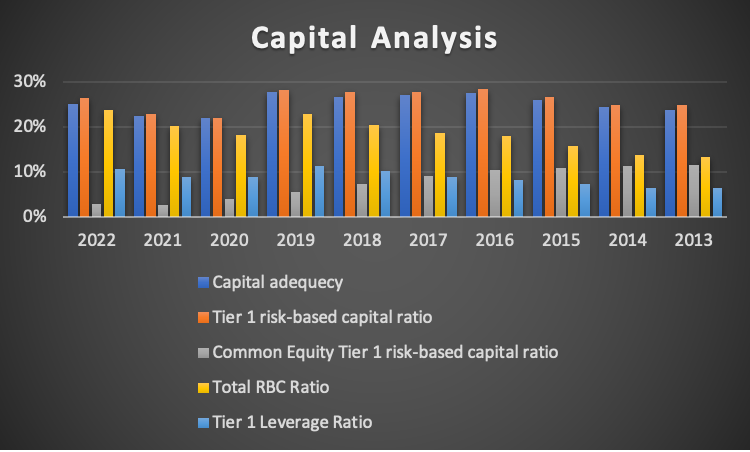
The capital adequacy had fluctuated ratios, with some having up 22%, while the highest was at 26%. The ratio indicates that the bank was operating above the minimum value of 8%. Hence it was well-capitalized for the period. The second ratio, the tier 1 risk-based capital ratio, indicated it was above the minimum value since all the ratios were above 20%. This indicated that the bank could cover the risks of the asset using tier 1 capital only. The third, the total risk-based capital ratio, indicated that there was also capitalization since all ratios were above the minimum amount required per the Basil III regulation (Obadire, Moyo & Munzhelele, 2022). The common equity tier 1 risk-based ratio shows that the value fluctuated and decreased from 2013 to 2022. The graph below shows that from 2013 to 2017, the bank was operating above the minimum value of 8% but then dropped to 2022. The value indicated that from 2018 to 2022, the bank was performing below the required minimum value, which violate the Basil III regulation and may cause an economic crisis in the country. There were major reported bank crises in America and other parts of the world. This may be the main reason for the drop in the ratio in recent years.
The leverage ratio, on the other hand, increased from 2013 to 2022. In 2013, the bank was underperforming since the leverage ratio was below the required amount but it increased up to 11% in 2022, which was an indication that the bank’s performance in managing the leverage ratio increased significantly.
Wells Fargo Bank Analysis
Wells Fargo is a financial institution that provides banking and asset management services to several people across its subsidiaries. The bank specializes in retail and wholesale banking services and wealth management. The financial information from the bank website and micro trends have helped establish five capital ratios which helped in assessing the company’s capital. The results are as follows:
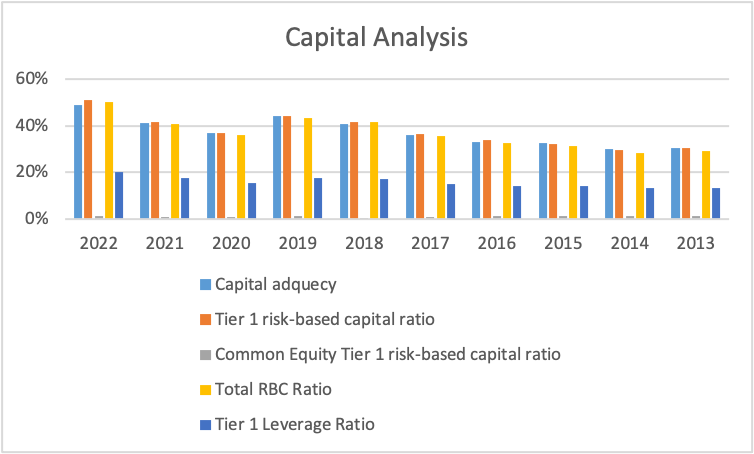
The analysis shows that the capital adequacy ratio increased from 2013 to 2022, and all the ratios were above 20%, while others were above 40%, indicating that for all ten years, the bank operated above the required minimum value. Secondly, the tier 1 risk-based capital ratio shows that the bank ratio increased from 2013 to 2022, and all the ratios were above the minimum ratio of 8% (Abbas, Ali & Rubbaniy, 2021). Thirdly, the total risk-based capital ratio also was higher than the required minimum value for the three years. The ratios also increased from 2013 to 2022, an indication of improvement each year. The common equity tier 1 risk-based capital ratio showed they were all operating below the required rate of 8%. All the values below were not greater than an indication of a higher risk for the bank in relation to the risk-weighted assets. Lastly, the tier 1 leverage ratio shows an increase in the values from 2013 to 2022, and the values were above the minimum value of 8%, indicating good performance. In summary, Wells Fargo’s bank capital analysis indicates that only the capital adequacy ratio was below the minimum value given by the Basil III regulations, while the other ratios met all the thresholds. This was an indication that the bank was managing the capital risks.
Godman Sachs Bank Analysis
The Goldman Sachs Group, Inc. is a global financial service provider dealing with banking security and asset management. The overall importance bank serves various clients from groups, individuals, businesses, and even government. It is also one of the top banks in the United States, which makes it fit for analysis. The financial information used in this analysis was obtained from Microtrends and then the bank’s website. The ten years capital ratio analysis help in identifying the bank’s strength and weaknesses in managing and following the Basil III regulations. The analysis provided the data as shown below.
The analysis involved different ratios, as shown in the graph above. The first ratio was to determine the ability of the bank to meet the risks for the weighted assets, which has a regulated ratio limit of 8%. According to the figures above, the capital adequacy ratio increased from 2013 to 2022, with 2013 having a rate of 11% above the minimum value. The other years had more than 11% values, with 17% being the highest in 2019. The data shows that for the ten years, the bank was able to maintain a health-adequate ratio, indicating that all the tier 1 and tier two risk capital could meet the risk-weighted assets for ten years. The second ratio was the tier 1 risk-based capital ratio, which involved assessing the ability of the tier 1 capital on the average weighted assets. Basil III requires banks to operate above the minimum value to help avoid bankruptcy and even country crises. The calculated results show that the ratio was higher than the minimum rate since the lowest value was 10%. In 2019, the values increased to the highest rate of 17% but decreased in the preceding years up to 2022, but there was still a higher value of more than the 8% minimum value.
The third ratio was the common equity tier risk-based ratio, which involves the common stock of the bank’s risk-weighted assets. According to the results, the ratios were almost zero throughout the ten years; the bank operated at a rate of less than 0.03%. The main reason was the low value of the bank’s common stock, resulting in lower values for the years. This indicated that the bank could not utilize the available net common stock to handle the asset’s risks (Oino, 2021). The fourth ratio was the total risk-based capital ratio, which was the total capital over the bank’s total assets. Capital refers to what the bank has and the ability to pay the assets in case of any default (Duho & Onumah, 2019). The ratio also shows that it increased from 2013 to 2019, then decreased to 2022. The data also shows that throughout the ten years, the ratio was above the minimum value of 8%, indicating the better performance of the bank following the set down-regulation. Lastly, the tier 1 leverage ratio also increased from 2013 to 2019 and then decreased to 2022, but the values were above the minimum values set. In conclusion, the bank’s common stock was the only one operating below the minimum requirement, while the other ratios met the threshold. Most of the ratios also show an increase from 2013 to 2019, then a decrease to 2022 due to the increased interest rates and even the economic crisis experienced in 2020.
TD Group Holding
The TD Bank Group is also a multinational bank with more than 90,000 employees across the globe. The bank provides financial assistance and management to individuals, retail, and large and small organizations, among other customers. The bank adopted the Basil III and has to regulate the capital ratios, identify trends, and the usefulness of the information. The financial information that helped the analysis was retrieved from the Bloomberg and bank websites. The ratios were presented in Excel and helped in making the graph below for easy interpretation.
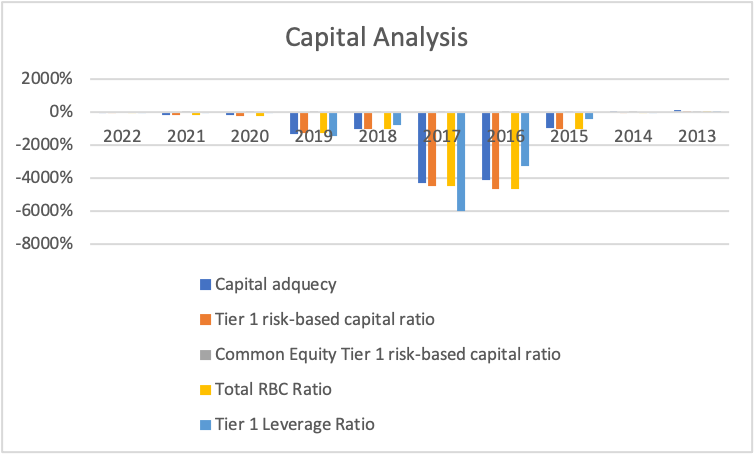
The table above shows that all the ratios were negative from 2013 to 2022. Additionally, it shows that the ratios declined from 2013 to 2017, then increased again in 2022, but the values were still negative. According to Oino (2021), negative values indicate that the bank violates the Basil III regulations and has the possibility of being bankrupt. The figures above concerning the bank indicate that it has no performing ratio, making it hard to reduce any bank risk, especially on the average weighted assets. In conclusion, the bank still needs to achieve the regulations provided for the banks.
Summary
The analysis comprised five banks, each with ten years of financial analysis for five key ratios from five banks. Each bank had different trends in managing capital for ten years and meeting the minimum requirement. According to the findings, most banks could meet most of the capital ratios, but some only achieved the tier 1 common equity ratio for ten years. Only Bank of America could meet the minimum values from 2013 to 2017, while the other banks still needed to meet a ten-year limit. According to the analysis, the TB bank did not meet any of the thresholds for the ten years. This means the bank is at risk of bankruptcy because of violating capital regulation measures.
References
Abbas, F., Ali, S., & Rubbaniy, G. (2021). Economics of capital adjustment in the US commercial banks: an empirical analysis. Journal of Applied Economics, 24(1), 71-90.
Arnianti, A. (2022). Analisis Kinerja Reksa Dana Syariah di Pasar Modal Indonesia dengan Menggunakan Metode Information Ratio= Analysis of the Performance of Islamic Mutual Funds in the Indonesian Capital Market using the Information Ratio Method (Doctoral dissertation, Universitas Hasanuddin).
Duho, K. C. T., & Onumah, J. M. (2019). The Determinants of Intellectual Capital Performance of Banks in Ghana: An Empirical Approach.
Obadire, A. M., Moyo, V., & Munzhelele, N. F. (2022). Basel III capital regulations and bank efficiency: Evidence from selected African Countries. International Journal of Financial Studies, 10(3), 57.
Oino, I. (2021). Regulatory capital: Implications on credit creation and profitability. Cogent Economics & Finance, 9(1), 1955470.
 write
write