Introduction
According to economists, inflation has been recognized as the parent of unemployment and an unseen robber of savings made by individuals. Therefore, a history was created that portrays a negative relationship between unemployment and inflation. As years passed by, the relationship evolved into a complex state. Unemployment is when individuals can work but cannot secure sustainable jobs. The Bureau of Labor Statistics gives a more specific definition. It is believed to be people with no jobs have looked for jobs, and importantly they are available for any opportunities. Unemployment is brought about by various factors, especially at the national level. One of the factors included economic slowdowns whereby businesses are forced to minimize their spending; hence there are not enough resources to guarantee new opportunities. On the other hand, inflation includes a rapid rise in consumer prices, which may have a small impact on daily finances. Inflation thus has become a quantitative approach that measures the rate at which prices of products increase in a period. As a result, the currency buys less compared to prior periods.
For several years, economists have conducted discussions regarding the relationship between unemployment and inflation. Therefore the paper discusses the historical relationship according to Phillip’s curve, provides a macroeconomics analysis of the short and long-run differences, and assesses the 20-year US data to identify the short-run impact on Philip’s curve. Additionally, the paper also evaluates the validity of the Philip curve to resolve issues in unemployment and inflation and forecast such challenges. Lastly, a policy will be recommended, whether monetary or fiscal, to deal with inflation and unemployment.
The historical relationship between unemployment and inflation
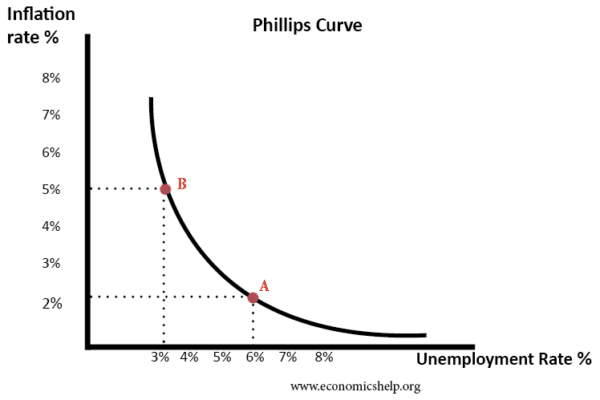
According to Philip Curve, unemployment and inflation have had an inverse relationship. The curve originated from the analysis conducted to compare unemployment and wage growth. Higher inflation emerges due to low employment levels, while low inflation occurs due to high levels of unemployment. Therefore, as inflation tends to fall, unemployment rises and vice versa. The British economist A.W. Phillips substituted price inflation from developed countries and observed similar behavior (Jordà et al. 2019). The Philips curve shows that policymakers cannot influence inflation or unemployment without impacting the other. Therefore, a trade-off would emerge such that a small increase in inflation accompanies a slight unemployment decrease. Hence the Philip curve provides a deterministic relationship between inflation and unemployment. This means that the amount one quantity has is dependent on the amount existing in the other quantity. Therefore, the policymakers cannot control unemployment and inflation simultaneously.

https://www.economicshelp.org/blog/1364/economics/phillips-curve-explained/
Despite the illustration provided on the Phillips curve, some economists questioned some assumptions made from the curve. They argued that the one-to-one relationship no longer existed. Such claims were made by American economists Milton Friedman and Edmund Phelps, stating that the trade-off could only occur in the short-run (Gordon, 2018). In the long-run approach, without considering the inflation rate, the unemployment rate is believed to gravitate towards the natural unemployment rate. This is the amount of unemployment when an economy is productive based on potential output. Therefore, the assertion concludes that multiple Phillips curves exist whereby the relationship between inflation and unemployment mainly depends on the natural unemployment rate, the economy’s capability, and the total supply of goods and services.
Distinguish between the short-run and long-run in macroeconomic analysis. Why is the relationship between unemployment and inflation different in the short-run and long-run?
The short-term and long-term are two key macroeconomic sectors in unemployment and inflation. One of the key differences between the two is that they are unstable such that there is no balance between properties and associated costs. In the study involving economics, the short and long run do not refer to a certain period but consider conceptual time (Abu, 2019). Hence the primary difference becomes flexibility, and decision-makers seek options in the particular scenario. The long-term economic models move from the short-term balances whereby the supply and demand involved are flexible to the rates of prices. Hence, justifying the statement that the rosining unemployment level results from increased inflation. The inflation tests were conducted to illustrate the expectations that would allow companies to adjust the entire price levels (Abu, 2019). As indicated earlier, the Phillips curve remained valid until the challenge from Friedman and Phelps. They expressed their concerns about whether the curve was an excellent short-run and long-run relationship. The natural rate of unemployment cited thus would highly depend on the different labor market characteristics. They may include the ability to look for work, the strength of negotiations from trade unions, and wage legislation. Such an approach shows that a company encounters short-term trade.
Once the aggregate demand is raised, unemployment levels would fall, but inflation could increase. The perspective would contribute to high inflation levels; hence the relations between short-term and long-term are similar. However, as one way is effective, the other becomes long-lasting. According to the Phillips curve, the trade-off between unemployment and inflation occurs in the short term. However, some economists argue that the trade-off is weak hence cannot be considered. An increase in government purchases results in higher aggregate demand. Hence, the curve illustrates the chances of inflation and unemployment (Ho & Iyke, 2019). Joblessness tends to decline the possession of labor income; thus, consumer purchases rise. An increase in consumption raises the demand for products. Therefore, jobs and inflation have no relationship on a long-term basis. It is an indication that the rate of inflation is dependent on the increase in the money supply. In the short-run, a high unemployment circumstance leads to low inflation and vice versa. Therefore, the short-term fluctuations in the economy foster the growth of demand, GDP, and levels of the market. The employees want higher wages at higher costs. Such situations force companies to reduce the overall output.
Assess the recent 20-year US unemployment and inflation data. Do the current US unemployment and inflation data confirm the short-run Phillips curve?
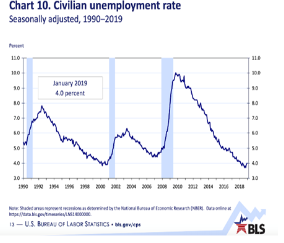
After examining the data, a negative relationship between inflation and unemployment is identified. The negative relation reinforces the phenomenon established in the short run of the Phillips curve. A small degree of unemployment and inflation between 2015 and 2016 explains about 43% of the total fluctuations encountered in a year (Ashley & Verbrugge, 2020). The data further shows that the levels of unemployment were key factors to the emergence of the high rate of joblessness represented by the recession.

The short-lived curve has therefore been validated through empirical evidence from American data. Therefore the relationship between inflation and unemployment is seen to be the opposite. Ultimately, the relationship would be observed through constant aggregate supply, allowing aggregate demand to change (Gabriel, 2021). Notably, the Phillips curve is not in a position to face modern challenges, considering the current figures for inflation and unemployment. The challenge is brought by the fact that the curve is labor-intensive and predictable. The advancement of technology in companies would require employers to hire fewer employees and pay low wages due to the desire to invest more money. Therefore, the curve was developed s compensation for inflation changes and long-term employment, introducing an approach referred to as Non-Accelerating Unemployment Inflation Rate. The approach argues that Phillips failed to indicate when a decline in unemployment would occur and inflation rise. Information provided indicates that the data between 1861 and 1957 indicates that wages would go up when unemployment decreased (Ashley & Verbrugge, 2020). Consequently, inflation goes up, making economists embrace the inverse relationship as a shorthand that predicts what is likely to happen in an economy. The inverse approach also serves as a clue when the major banks may increase interest rates to prevent inflation.
Analyze why the recent 20-year US unemployment and inflation data approves or disapproves of the short-run Phillips curve.
The short-term Phillips curve illustrates the short-term trade-off existing between the two variables. It is evident that unemployment leads to inflation; however, the concept took place a short time and was experienced in the 1960s. Therefore, the theory proved to be less accurate and incorrect. This is because it was identified as an unreliable policy and thus could not provide accurate information as both an instrument and indicator. Thus the increase in real output is significantly driven by the increase in demand for labor. It means that once unemployment increases, the output will also increase Hooper, Mishkin & Sufi, 2020). Thus more spending will be used on the economy to enable individuals to secure jobs.

Notably, inflation from demand is mainly a result of aggregated growth. Therefore, economists have indicated that the relationship between inflation and unemployment is the fundamental input in the monetary policy design. The reports show that unemployment in the United States is near the low record. Hence it is difficult to predict whether inflation will increase shortly. However, a conclusion is made that the dormancy of the Phillips curve price for decades does not necessarily indicate its death; it could just be silent (Hooper, Mishkin & Sufi, 2020). Therefore, it possesses risk where the curve would shoot with strong inflationary pressures creating issues in the labor market. Consequently, it is reasonable to conclude that the short-run Phillips curve was not evident as provided in the aggregate data. The uncertain data as to whether the curve is disproved or supported are only seen to be sleepy.
Evaluate whether the Phillips Curve can still validly resolve today’s issue of unemployment and inflation and forecast unemployment and inflation. Why or why not?
Inflation is a challenge that has not been connected to businesses’ cyclical ups and downs for the last three decades (Ashley & Verbrugge, 2019). The observation thus is a concern and enough reason that challenges the Federal Reserve to consider implementing the strategy to foster systematic monetary policy. The policy would help react to the off-target inflation despite being low or high. Notably, the Phillips curve’s position has significantly helped reduce problems associated with unemployment and inflation, although the government sometimes failed to achieve the goal (Ball $ Mazumder, 2019). Probably the loss due was contributed by the reversal of the relationship between the two variables. Therefore, it means that it was not stable in the long term basis. In the past, the curve was able to make predictions about issues of inflation and unemployment. However, I was identified as an insufficient approach to predicting relations. The policymakers were provided with inadequate guidance and strategies to overcome challenges brought by the variables.

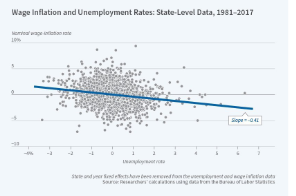
The figure above illustrates that as data is analyzed from 1988 to 2018, researchers obtain less support for the stability of the Phillips price curve. Both the linear and nonlinear lines are zero. This shows that the curve is flat according to the normal view. Notably, the Phillips pay curve is much better and has become noticeable today (Ashley & Verbrugge, 2019). However, as time passes, the effort to reduce the unemployment rate will result in o demand from employees for higher pay. Such a situation will eventually lead to inflation, considering that the world is still in a pandemic and unemployment is being experienced by most individuals.
Recommend a policy, opinions, or methods as a policymaker for either fiscal policy or monetary policy (or both).
Notably, considering the reports given by the Department of Labor, about 13.3% of the citizens were unemployed due to the limited resumption encountered in economic activity. The number has reduced from 14.7%, a key aspect to the economists. Even though unemployment would stop rising, the cost of preventing the variable from rising to a high level would be substantial. Therefore, full employment needs to be acknowledged to reduce the rate despite being a great challenge effectively. The government and other private institutions thus need to focus on creating more job opportunities for the citizens to improve the rate of economic growth. As individuals secure employment, it becomes easy for them to manage their lives and improve living standards. Therefore unemployment and inflation require a balancing technique.
Both fiscal and monetary policies are essential in balancing inflation and employment and ensuring every individual is not left out. The monetary policy entails effective control of the supply of money and the interest rates offered by the central bank. Key reduction measures need to be implemented by the bank to ensure affordable interest rates are offered to the public since borrowing would become less costly and the capital supply increase (King, 2020). On the hand, fiscal policy is involved with determining the amount the central administration pays for the required taxes the approach used to spend the available money. Hence the call for the government to support its economy should be facilitated by a reduction of taxes to increase expenditure. Therefore, the two should be used together to determine how and where resources are spent and effectively manage the supply.
Conclusion
The federal government in the United States enacted several steps to ensure a stable economic rate is achieved and inflation challenges are avoided. Although multiple policies have been implemented, the government needs to consider the fluctuation side. It could monitor the supply curve for final goods and services. Various assessments involving employment and inflation data need to be done regularly to determine factors contributing to the imbalanced economic state and implement effective solutions. The Phillip curve may play a role in the short-term impact of inflation and unemployment. Importantly, monetary and fiscal policies are useful on a long-term basis.
References
Hooper, P., Mishkin, F. S., & Sufi, A. (2020). Prospects for inflation in a high-pressure economy: Is the Phillips curve dead or is it just hibernating?. Research in Economics, 74(1), 26-62.
Ball, L., & Mazumder, S. (2019). A Phillips curve with anchored expectations and short‐term unemployment. Journal of Money, Credit and Banking, 51(1), 111-137.
Ashley, R. A., & Verbrugge, R. (2019). Variation in the Phillips Curve Relation across Three Phases of the Business Cycle (No. 19-09). Federal Reserve Bank of Cleveland.
King, M. (2020). Monetary policy: practice ahead of theory. In Policy Makers on Policy (pp. 73-89). Routledge.
Ashley, R. A., & Verbrugge, R. (2020). Finding a stable Phillips curve relationship: A persistence-dependent regression model. Available at SSRN 3393943.US.
Gabriel, R. D. (2021). Monetary Policy and the Wage Inflation-Unemployment Trade-off. Available at SSRN 3689791.
Abu, N. (2019). Inflation and Unemployment Trade-off: A Re-examination of the Phillips Curve and its Stability in Nigeria. Contemporary economics, 13(1), 21-35.
Ho, S. Y., & Iyke, B. N. (2019). Unemployment and inflation: Evidence of a nonlinear Phillips curve in the Eurozone. The Journal of Developing Areas, 53(4).
Gordon, R. J. (2018). Friedman and Phelps on the Phillips curve viewed from a half century’s perspective. Review of Keynesian Economics, 6(4), 425-436.
Jordà, Ò., Marti, C., Nechio, F., & Tallman, E. (2019). Inflation: Stress-testing the Phillips curve. FRBSF Economic Letter, 5(11).
 write
write