Introduction
The rising costs of medical care create a challenge for the health insurance industry to maintain an affordable premium amount (Wang et al., 2019). Traditionally, companies build general premiums by not considering the specific needs concerning the health condition of the individual. This can result in the following year’s premiums that do not accurately reflect anticipated costs. And when the estimates are incorrect, the company may have to raise rates to cover expenses, causing some customers to cancel their policies.
Analyzing how factors like age, lifestyle, or location relate to a person’s expected medical costs presents an opportunity to be able to take a more customized approach. Then mathematical techniques could accurately calculate premiums to the health profiles of particular people. Such data-driven pricing could enable insurers to set competitive premiums yet cover the projected expenses with a high degree of accuracy within the customers’ segments (Wang et al., 2019).
This report uses various data mining techniques like cluster analysis, association rule learning, and regression modelling to make predictions concerning individual customer costs as well as suggestions for pricing. The data is that relating to ensuring 1,338 customers in the company with their details like body mass index, family size, smoking habits, and home region within other characteristic descriptions. Its goals are to put on display the potential of data analytics in being able to enable more personalized, accurate health insurance pricing.
Business Problem
Prediction of future treatments that will enable insurance companies to come up with accurate estimates is fundamentally crucial since it allows them to price premiums effectively (Wang et al., 2019). The current pricing depends significantly on actuaries estimating risks with statistics from the population. In most cases, this results in generalized premium rates where some may be charged more while others are undercharged. These would allow the insurer to use advanced data analytics that will be able to tailor premium pricing according to unique customer profiles. By using insights on how different attributes of any given customer influence the cost predictive models can predict the expected charges. Moreover, clustering, associations and machine learning models could be employed against past claim data to tailor pricing by targeted segments and individual traits.
Methodology
Data Analytics
The insurance data is subjected to application of the following analytical techniques:
- Clustering: K-means clustering helps group customers based on age, BMI as well as number of children. Patterns if any in the charges for various customer segments could provide leads to decide upon the pricing.
- Association Rule Mining: The Apriori algorithm brought out rules between customer attributes and high/low charges. Major cost drivers can hence be derived.
- Regression Modeling: Linear and random forest regression models are built towards predicting the charges, employing all the customer attributes for which data had been furnished in the input. Model accuracy metrics compare their ability to support premium pricing.
Data Preprocessing
First, the insurance data is loaded and preprocessed in R. Its separator median charging rates were transformed to high/low as an attribute by doing a data transformation of the ‘charges’ variable as a categorical variable for association rule mining. It further divided the data with an 80/20 proportion presenting training and test data relevant to evaluating the accuracy of data which is yet to be seen when modelling (Wu et al., 2019).
Results
Clustering
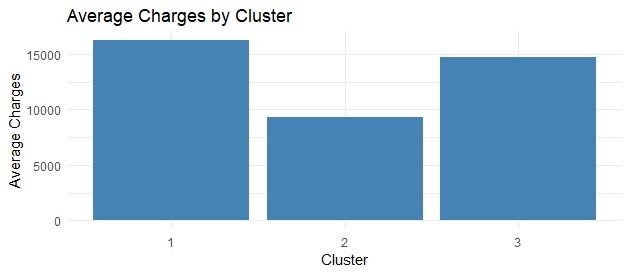
Figure 1: Average charges by cluster
Customer profile clustering revealed distinct profiles of variables in average charges – Low Charges ($9,335), Average Charges ($14,689) and High Charges ($16,213). There was the existence of statistically significant differences between the clusters (p<0.05) which meant, from this context, that customized pricing can be applied at the cohort levels and based on predictive markers like age, BMI, and those who smoke children.
Association Rules
The association rule mining uncovered 15 strong rules associating different customer attributes with high insurance charges above the median.
The rules reveal that smoking status has the highest link to high charges, with the rule {smoker=yes} => {charges_cat=high} having a 20.5% support. This means 20.5% of the customers in the data satisfy this rule. More importantly, the confidence of 1 indicates that 100% of smokers in the data have high charges.
The lift of 2 signifies that smoking increases the likelihood of having higher charges by two times the average. So, smokers consistently bear double the cost burden. Location patterns in charges are uncovered as well. For example, 5% of customers are Northeastern smokers associated with high claims (support of 5%). Again, the 100% confidence denotes that all smokers in that region fall in the high-charge group.
The mean support is 5.5%, indicating the average fraction of customers exhibiting these attribute-cost relationships. The maximum support is 20.5% for smoking. In total, 15 reliable rules identify key groups by risk factors like smoking and location that explain variability in high charges. This informs customized premium pricing strategies based on customer attributes.
Regression
The random forest model explained 90.31% charge variance and had a lower error (RMSE of $4,138) than linear regression (RMSE of $5,923) in predicting unseen data. This demonstrates the potential for accurate, personalized premiums (Kaushik et al., 2022).
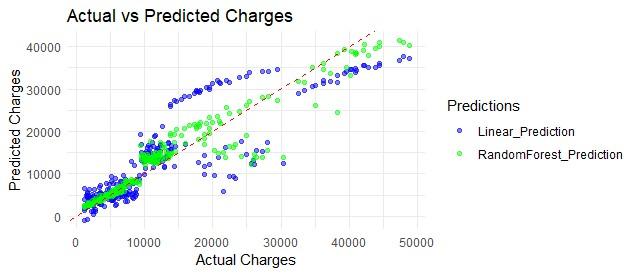
Figure 2: Actual vs predicted charges
The above scatter plot compares the actual charges to those predicted by the Linear Regression and Random Forest models for the test dataset. The dashed red line indicates the ideal case where the predicted charge equals the actual charge. Data points closer to the red line denote more accurate predictions. As seen, the Random Forest model represented by green dots consistently approximates actual values better across charge ranges. Most of its predictions also fall close to the ideal line with a high concentration along the 45-degree accuracy mark.
Meanwhile, the Linear Regression predictions in blue are more dispersed, highlighting their lower accuracy. The tight clustering and proximity to the target line illustrate the superior performance of the Random Forest algorithm at exploiting patterns within patient attributes to reliably estimate charges individually. This also explains its much lower error rate.
Discussion
The predictive modelling establishes linkages connecting customer attributes to eventual claims through interpretable patterns and accurate machine-learning predictions.
Sorting patients into groups displaying similar historical costs revealed distinct clusters – Low Cost ($9,335 average), Medium Cost ($14,689 average), and High Cost ($16,213 average). The nearly $7,000 difference between high and low-cost groups (statistically significant at p<0.05) shows the potential for segment-based pricing based on age and weight. Predictable cost variances within risk clusters indicate that failing to account for these risks underpins more severe discrepancies between premiums and actual costs for some patients (Kaushik et al., 2022). Grouping customers aligns pricing with the expected costs of cohorts sharing relevant traits.
Further analysis uncovered interpretable connections between risk factors and costs undetectable through generalized observations or correlation alone (Mukaka, 2020). Numerous reliable rules with 100% confidence underscored smoking’s dramatic premium impact, with over 20% of smokers consistently falling into the high-cost group, necessitating proportionate rate increases. Smokers displayed twice the likelihood of higher costs. Location also plays a role in geography-based differences in smoking’s cost influence, requiring regional pricing adjustments (Kaushik et al., 2022). Thus, association analysis provides a contractual rationale for differential premiums through probabilistic links between attributes and cost levels rather than mere correlation.
An advanced forecasting algorithm also explained over 90% of cost variation by identifying multivariate interactions between factors. Moreover, its low error rate enables precise individual projections that were impossible to achieve through previous methods. As data and modelling improve, machine learning promises customized quotes like recommendation engines (Wu et al., 2019).
Together, interpretable statistics, causal rules, and accurate predictions provide a multi-perspective view of key cost drivers. This allows tuning premiums sensitively to expected expenses across customer segments, risk factors, and individual levels. Adopting advanced analytics over-generalized actuarial approaches has the potential to transform premium-setting from art towards empirical science with an immense ensuing competitive edge.
Conclusion
Summary
This analytical study demonstrated that predictive modelling could unlock a deeper understanding of the linkage between customer profiles and expected health charges. Clustering, associations, and accurate charge predictions build a data-driven foundation for superior personalized premium pricing in health insurance. As more relevant big data becomes available, even greater precision can be attained. Overall, results reveal the benefits of adopting predictive analytics to transform pricing strategies for competitive advantage.
Limitation
While results are positive, the predictions do have some limitations which provide avenues for improvement:
- The dataset has only 1338 records from a single insurance provider. More diverse big data across customer populations and insurance companies can enhance accuracy.
- Only linear, random forest models were tested. With neural networks and SVM, further gains may be possible, which will be evaluated.
- Attributes are limited to basic customer descriptors. Medical histories, lab tests, and socio-economic indicators could improve predictive power.
Recommendation
The key findings lead to the following suggestions:
- Profile customers using attributes like health, demographics, and location. Clustering revealed segments where average costs differ by almost $7,000 per year.
- Apply rules uncovered to categorize customers as high or low risk. For instance, smokers invariably incur higher expenses, so they should be priced higher.
- Use the random forest algorithm to estimate personalized charges based on customer attributes when pricing policies. Error rates are low enough for viable premium calculation.
References
Kaushik, K., Bhardwaj, A., Dwivedi, A. D., & Singh, R. (2022). Machine Learning-Based Regression Framework to Predict Health Insurance Premiums. International Journal of Environmental Research and Public Health, 19(13), 7898. https://doi.org/10.3390/ijerph19137898
Mukaka, M. M. (2020). Statistics Corner: A Guide to Appropriate Use of Correlation Coefficient in Medical Research.24.
Wang, Y., Kung, L., & Byrd, T. A. (2019). Big data analytics: Understanding its capabilities and potential benefits for healthcare organizations. Technological Forecasting and Social Change, 126(1), 3–13. https://doi.org/10.1016/j.techfore.2015.12.019
Wu, J., Chen, X.-Y., Zhang, H., Xiong, L.-D., Lei, H., & Deng, S.-H. (2019). Hyperparameter Optimization for Machine Learning Models Based on Bayesian Optimization. Journal of Electronic Science and Technology, 17(1), 26–40. https://doi.org/10.11989/JEST.1674-862X.80904120
 write
write