Introduction
Gati has become one of the prominеnt logistics and supply chain providers over the years, earning its reputation through its commitment to providing timely and damagе-frее shipments. The company is headquartered in Hyderabad-India, where its major processes are controlled and managed due to the dynamic market; besides logistical services, the company also offers a diverse range of services, including e-commerce solutions.
Owing to its strategic plan, the company has recently introduced a service scheme called the “premium еxprеss scheme,” where the customers are expected to subscribe to premium services; this scheme, as opposed to the previous ones, guarantees timely deliveries of goods within 72 hours after the order is placed. However, customer complaints have risen, most of them from premium customers raising concerns about the delay of deliveries. The case study will serve as a ray of hope for the company by exploring the root causes of these delays and devising statistical solutions to optimize the delivery process; it will enable the general manager to gain valuable insights from analyzed customer complaints data for informed decision-making.
The manager knows that customer satisfaction defines their success within the competitive industry. According to Leuschneret al. (2013), customer satisfaction is the ultimate goal of every business. Due to this, the general manager of Gati, who is also the person responsible for ensuring quality service delivery to all the customers and services provided by the company, became concerned about these complaints raised by customers in the scheme and wanted to devise a strategy that would identify the cause of the problem and a solution to mitigate it; therefore this study comes as an advantage to the company which is looking for alternatives to improve its services and stay ahead of the competition in the market;
Statement of problem
Based on the explanation provided, we noted that Gati faces an increase in customer complaints related to delayed shipments under the premium еxprеss scheme, despite the company’s strategy of making this scheme faster in making deliveries. According to complaints made by a proportion of customers, there is a higher variance in the promise of faster 72-hour delivery guaranteed by the company with the actual delivery time. Murarka’s immediate concern is to identify the root causes of the delays and implement nt an effective statistical strategy to rectify the situation, as the company’s reputation is at stake, given the intensifying competition from other companies within the logistics industry. Relying on this, we will aim to provide a comprehensively understand of the challenges faced by the company and the steps needed to resolve them. In addition, we will analyze the potential cause of all the delays experienced by customers and use insights from the finding to aid the manager in making decisions that will restore the smoothness of running logistics operations.
Background Information
Gati has been at the forefront of the logistics industry. Since its founding in 1989, The company has consistently set new standards by providing outstanding logistics services in India; driven by its commitment to excellence, it has consistently improved customer experience by providing innovative logistics services. Gati provides logistics services to nine distinct industries, such as e-Commerce, Healthcare, Fast-Movin Consumer Goods, Electronics, and Automotive, requiring a comprehensive and flexible approach to their logistics needs. To meet these, Gati has developed a network of high-quality warehouses operational 24 hours a day, seven days a week across the country, spanning more than thirteen million square feet.
With forty-eight strategically located hubs (or mega hubs), the company connects nearly every corner of the nation, catering to a wide range of customers. The company introduced a premium express scheme in response to its increasing customer base and quality demands. The scheme was specifically designed for those customers who wanted to receive their delivery within 72 hours of placing an order. Since the customer who opted for these services had to pay a premium fee, the company could increase its revenue while providing quality services. However, it encountered difficulties meeting the promised delivery timeline, as evidenced by customer complaints.
Furthermore, the scheme presented further difficulty in monitoring process performance and determining process capability. In response to this, the company intends to analyze the root causes of the delays and implement targeted solutions to improve the scheme’s overall performance. By analyzing data collected from the company’s personnel and customer grievances, the company can make informed decisions to resolve its issues, thus strengthening its reputation as a reliable logistics provider and concentrating on improvement and customer satisfaction.
Methodology
The methodology in this study included the quantitative and qualitative approaches; in order to answer the research questions, we will follow the following methods:
Research Design
According to Lеavy (2023), a research design is a statistical strategy used to provide answers to research questions or test for statistical hypotheses in order to address the research problem by obtaining relevant results. In our case, we will utilize the secondary data already collected by the Gati company. The study will analyze customer complaints per week and conduct a statistical analysis to determine if the complaints are under statistical control. Control charts will be used to monitor complaints over time. In addition, we would want to determine the root cause of the complaints made by Gati’s Customers; with this, we would analyze the data provided by the company employees. Our research design will also include the calculation of process performance metrics; this analysis will be visualized using Pareto charts and statistical process control charts.
Data collection
For this case study, we will primarily rely on the secondary data already collected by Gati company; the data include employee perceptions and responses om probable causes of delay in deliveries and customer complaints related to delayed delivery collected on a weekly basis. By conducting a statistical analysis of both data, we will determine the cause of customer complins and provide valuable insight for the decision-making process.
Sample size
The study employed a constant sample size of 200 participants each week based on secondary data from the company. However, the company increased the sample size to 260 from week 5 all the way to week 20; this increase in sample size allows for a detailed analysis of process performance for customers in the premium express scheme. With the data, a proper determination of the scheme’s efficiency and effectiveness over time will be made. Expanding the sample size led to a more comprehensive representation of the data to identify any specific pattern or trends which may not have been seen with a sample size of 200. The sample size in our study is a proportion of customers.
Data Analysis
In this case study, we look at two main areas of data analysis. First, we look at the data from Exhibit 1, which shows the number of customer complaints about late shipments with the premium express scheme. We use control charts and statistical methods to track the process over time and see if there are any trends, changes, or patterns; this will help us figure out if the scheme is meeting its delivery targets or if there are any particular times when there are more complaints. We also look at the responses from Exhibit 2, which show Gati’s employees’ opinions on the likely causes of shipment delays.
Exhibit 1
p Chart Formulas
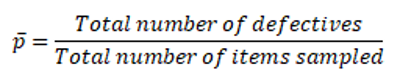
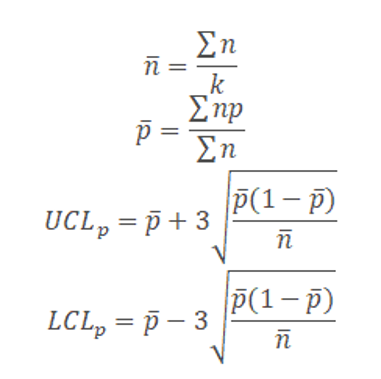
Where np = number of defectives in the sample
k= number of lots
n= sample size
To determine whether the process of the premium express scheme falls under statistical control, we will collect and collate the process data and other relevant information, such as transport. To illustrate this, we will draw a graph for the defect count from the data in Exhibit 1.
Root Cause Analysis
RCA (Root Cause Analysis) is a systematic methodology for determining the root cause or root cause of a problem or adverse outcome; the primary objective of RCA is the identification of the underlying cause rather than the identification of symptoms or superficial elements (Varma & Lal, 2020). By addressing the underlying cause, organizations can implement effective and durable solutions to avoid repeating the problem.
Pareto Chart
Pareto charts, also referred to as Pareto diagrams, are visual representations of the relative significance of various factors that contribute to a particular issue. Drawing on the principle of Pareto, which is also referred to as the 80 / 20 rule, practitioners can identify and prioritize their efforts to address the root causes of a problem (Varma & Lal, 2020).
Data Analysis
Figure 1:
Process Capability and Process Capability Index
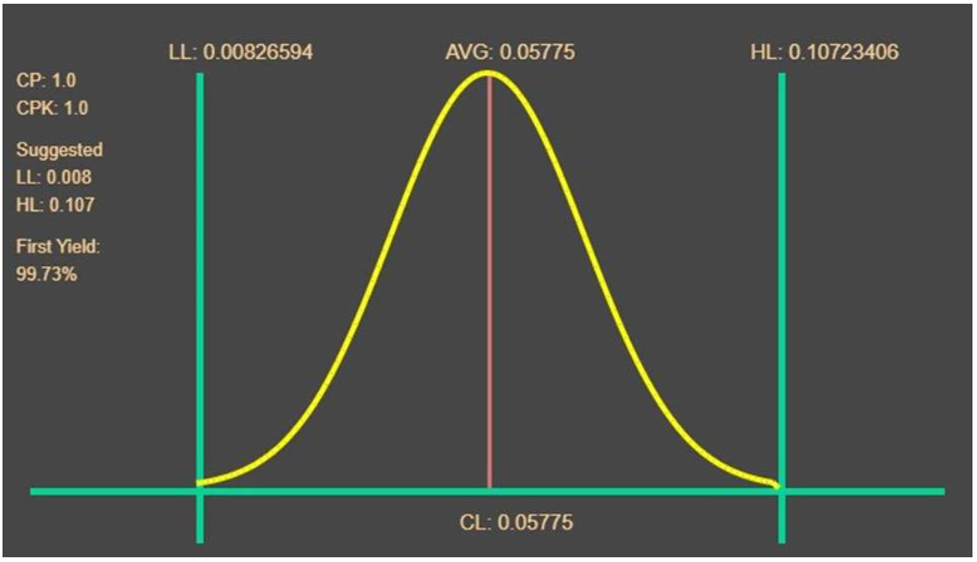
It is evident from the above figure that Cp = Cpk; thus, the process has reached its maximum potential. Nevertheless, it is essential for Murarka to identify the most common causes of variations by narrowing down the design specifications. By doing so, it will be possible to increase the process capability Index (CKI) to a higher than one value.
Statistical process control to find out if the process involved in the premium express scheme is under
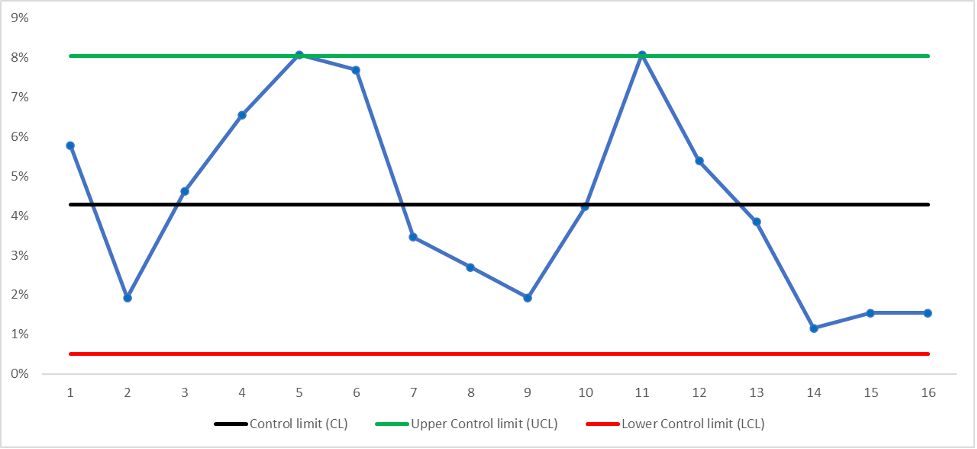
Figure 2
statistical control
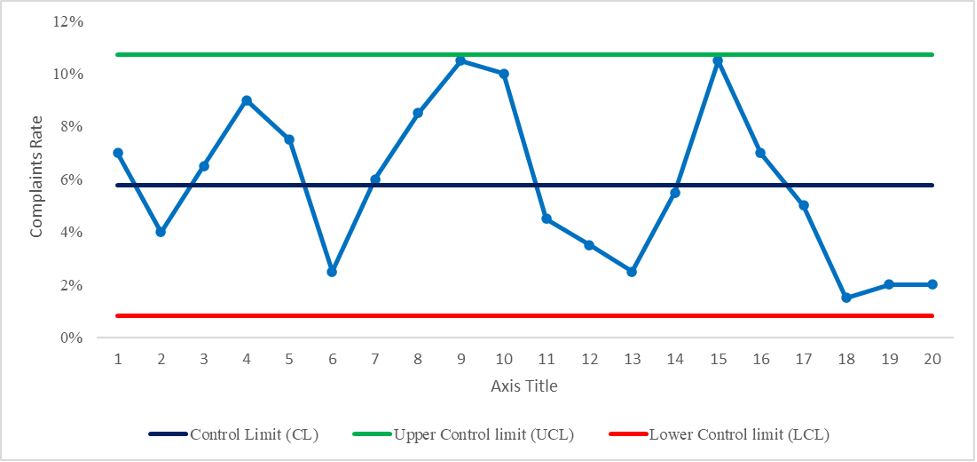
Figure 2 above shows that the number of complaints is within the acceptable limits (UCL) and within the acceptable range (LCL); this suggests that the procedure is within control and functioning within acceptable parameters. The proportion of complaints over time is relatively stable and consistent, with no significant fluctuations that would be cause for concern; this is a desirable outcome for the organization, as it indicates that customer complaints are in the expected range and the process is functioning within the expected parameters.
Identifying Potential Causes for Delay in Delivery of Shipments under Premium Express Scheme
Murarka requires the use of a cause and effect diagram in order to identify the potential causes of the delays in deliveries under the premium express scheme. This diagram will enable the company to identify as many potential causes as possible and categorize their ideas; this will enable Murarka to identify all the essential issues that could have contributed to the delays before creating a solution to address the problem; this will help to resolve the matter in its entirety before attempting to address any part of the problem.
The approach for Identifying Major Causes for the Delays
In order to identify the primary causes of shipment delivery delays, one of the most effective strategies that can be employed by Murarka is to utilize the Pareto chart to identify the most significant factors that may have contributed to the delay. This approach will enable Murarka to identify the areas that need to be addressed first in terms of process improvement by separating the more complex aspects of the issue from the more basic ones; this will enable them and their team to determine where to focus their efforts. Through the use of Pareto Analysis, the potential causes of the delay can be evaluated and prioritized by comparing the size of each cause.
Figure 3
Identifying Major Causes for the Delays
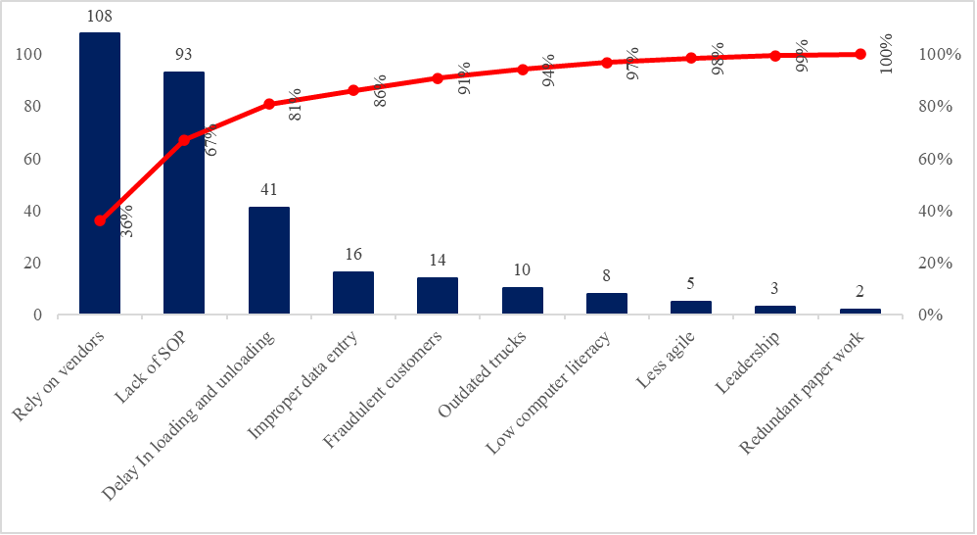
From Figure 3 above, It can be seen from the graph that the most common cause of the delays is the reliance on local vendors for smaller operations; thus, their performance is contingent upon the performance of local vendors rather than their current delivery fleet. Additionally, besides the lack of SOP, the graph indicates that there is a delay in the loading and unloading of the shipments, which is the cause of the delays in deliveries.
Analysis of Process Performance based on increased sample size from 200 to 260
Figure 4
The customer complaint control chart illustrates the proportion of complaints that the customer care team receives in comparison to the number of defects reported each week. The majority of the data points within the control limits indicate that the process is maintained and under control. However, two data points for the 5th weeks and 11th weeks appear to touch the upper control limit; this indicates a significantly higher proportion of complaints in these weeks than in the average week. It is essential to further analyze these data points to comprehend the reasons for the rise in complaints in these particular weeks.
Gati’s Premium Express Scheme was monitored using the control chart to track customer complaints over a period of time. If the Week 21 data point revealed that the number of complaints was below the(LCL), then this will be considered a positive result. When the data point is below the LCL, it indicates a process that is performing better than anticipated and meeting or surpassing customer expectations; this is a positive indication for Gati that the Premium Express Scheme is operating in a better way, thus increasing customer satisfaction. With this, Murarka can take comfort in the stability and predictability of the Premium Express Scheme. However, it is important to continue monitoring the process regularly to ensure the continued high level of performance. This regular monitoring and analysis will allow Gati to remain competitive in the market and maintain customer loyalty in the long term.
Conclusion
Murarka faced a major challenge that threatened the company’s image and reputation as a logistics solutions provider. He wanted to build his reputation as a quality professional in the company by getting it back on track by solving its problem. But it’s clear that it wasn’t going to be easy for him as he needed to investigate the problem and find a solution to optimize the delivery process to achieve the target defect ratio; this is because he needed to assess process variations in the Premium express scheme and find the areas that were causing the delays in most of the cases. Process variations are known as the consequence of imperfections which can lead to reduced performance, such as in the case of delays. He also needed to perform a process capability analysis using practical approaches of the process under statistical control to see if the process met the target defect ratio and if the company achieved its target.
References
Abtew, M. A., Kropi, S., Hong, Y., & Pu, L. (2018). Implementation of statistical process control (SPC) in the sewing section of the garment industry for Quality Improvement. Autex Research Journal, 18(2), 160–172. https://doi.org/10.1515/aut-2017-0034
Leavy, P. (2023). Research design: Quantitative, qualitative, mixed methods, arts-based, and community-based participatory research approaches. The Guilford Press.
Leuschner, R., Charvet, F., & Rogers, D. S. (2013). A meta-analysis of Logistics Customer Service. Journal of Supply Chain Management, 49(1), 47–63. https://doi.org/10.1111/jscm.12000
Montgomery, D. C. (2020). PROCESS AND MEASUREMENT SYSTEM CAPABILITY ANALYSIS. In Introduction to statistical quality control (pp. 345–367). essay, John Wiley & Sons, Inc.
Ott, L., Longnecker, M., & Draper, J. D. (2016). Statistical methods. In An introduction to statistical methods and data analysis (pp. 2–9). introduction, Cengage Learning.
Selvamuthu, D., & Das, D. (2018). Statistical Quality Control. Introduction to Statistical Methods, Design of Experiments and Statistical Quality Control, 353–398. https://doi.org/10.1007/978-981-13-1736-1_10
Varma, J. H., & Lal, S. (2020). Root cause analysis of newsprint waste using Pareto analysis and cause and effect matrix. IOP Conference Series: Materials Science and Engineering, 810(1), 012072. https://doi.org/10.1088/1757-899x/810/1/012072
 write
write