Introduction
This paper on the weather patterns of Vancouver from March 31 to April 4, 2024, comprises numerous hours of data collection to investigate the atmospheric determinants throughout this period. The study employs data from such sources as Environment and Climate Change Canada and an atmospheric weather station at YVR to reveal more precise, detailed weather dynamics. It aims to incorporate climatic data and visual depictions of this data in the form of satellite images, weather maps and radar visuals to understand the nature of the climatic conditions in the observed period that are evident from the fluctuating temperatures, precipitation events and irregular winds. By comparing the retrieved data with historical averages and considering the regional phenomena, we reveal the intricate relationship of geographical features and atmospheric dynamics that lead to Vancouver’s climate.
Data Collection
To carry out a topic-wide survey of weather patterns in Vancouver from March 31 to April 4 2024, a meticulous collection of data was done from various reliable sources, providing a firm ground for overall information. Environment and Climate Change Canada (ECCC), the country’s weather services agent, is accessible through its weather databases and cutting-edge forecasting tools. An atmospheric weather station, which was run by the Canadian Environment and Climate Change department, set up at YVR (Gultepe, 1865), was a point station that allowed for high-accuracy readings of the particular conditions prevailing in the surrounding geographical area. On March 31, it heated up with the highest temperature recorded in the City boundary of 13°C while simultaneously the minimum temperature was five °C (EC, 2024). The next day, April 1, it was again quite warm, with a temperature reaching the mark of 15°C and decreasing down to 7°C, accompanied by the clear sky. This phase is also credited to the formation of the weather pattern, which is favourable for the blooming of springtime (ECCC, 2024).
Nevertheless, the weather changed significantly starting on April second morning, with more of the impulses of the clouds turning into rain. In the YVR station, records indicate the temperature on this day was a maximum of 15°C and a minimum of 5°C (EC, 2024). The precipitation report presents the accumulated precipitation of 8.2 mm for the day. With this modification in condition, the impact of the weather system becoming part of the vicinity was suggested. On April 3, there is a 40% chance of showers, accompanied by a daytime temperature of 9°C and night chills of 1°C, according to the weatherman’s advice (ECCC, 2024). The information about wind speed also came from the station located in YVR. It highlighted the presence of this weather system as the wind speeds directed to 35 km/h are pretty high measurements for atmosphere dynamics (ECCC, 2024). In conclusion, we returned to the nearly standard spring climate conditions of April 4, but without sunshine – a mixed holding with a high of 12°C and a low of 2°C.
Visual Data
The collection of qualitative data and visual representations was critical to our understanding of how the weather changed from March 31 to April 4, 2024. Satellite images, weather maps, and radar visuals added a deeper dimension to the atmospheric processes, rendering a much clearer picture of the meteorological activities during these five days. The satellite images on March 31 reported a cloudless sky over Vancouver, coincidentally with the reported sunny conditions and the 13°C temperature. Nevertheless, towards the end of the week, the visuals started showing the indication of clouds being formed. By April 2, satellite images confirmed a massive cloud system moving towards the area, reinforcing the significant cloudiness and precipitation recorded at the Vancouver International Airport (YVR), which registered 8.2 mm of rainfall. The surface pressure maps were of great help in understanding the dynamics of the atmosphere that lie behind these weather changes. On April 3, these maps unmistakably demonstrated a low-pressure system headed towards the coast of British Columbia. This low-pressure system explained the gusty winds up to 35 km/h and the 40% probability of rain showers at YVR airport. The overlapping of the satellite images with the surface pressure maps gave a comprehensive image of the development, migration, and influence of the weather system on the local conditions.
Besides verifying the quantitative data, the visual aids provided valuable viewpoints and astounding meteorological patterns. Similarly, on April 4, when the conditions improved with a nice mixture of sun and cloud, the satellite pictures showed the dissipation of the cloud, and it aligned with the high recorded temperature of 12°C and the return to a more regular spring climate. By combining these graphic representations with numerical information, we thoroughly comprehended the atmospheric processes that governed the environment of Vancouver during the observation period. The careful analysis of the collected data generated several remarkable trends in the Vancouver weather system from April 30, 2024, to April 4, 2024. The readings of temperature followed a changeable trend where on March 31, the highs ranged from 13°C to 15°C on April 1st and 2nd before dropping to 9°C on April 3 and then bouncing back to 12°C on April 4. Such fluctuations in temperature could be due to the work of other climate phenomena that are contributed by the circulation of air masses and the action of weather systems.
Data Analysis
The careful analysis of the collected data generated several remarkable trends in the Vancouver weather system from April 30, 2024, to April 4, 2024. The readings of temperature followed a changeable trend where on March 31, the highs ranged from 13°C to 15°C on April 1st and 2nd before dropping to 9°C on April 3 and then bouncing back to 12°C on April 4. Such fluctuations in temperature could be due to the work of other climate phenomena that are contributed by the circulation of air masses and the action of weather systems. Also, April 2 was noted as heavy precipitation in the Vancouver International Airport (YVR) station that recorded 8.2 millimetres of rain. A significant precipitation event like this is related to a weather system. The satellite images and surface pressure maps showed an extensive cloud cover and a low-pressure system moving towards British Columbia. We might also witness the inconsistency in the direction of the wind. April 3 was the only unusually windy day, with wind gusts up to 35 km/h. The coincidence of this higher wind speed with the arriving low-pressure system supports the atmospheric dynamics as a critical factor of local weather conditions (Tarbuck, 130). The information should be compared with Vancouver’s historical averages and data records for data examination. Concerning long-term climate data from Environment and Climate Change Canada, it can be observed that the average high temperature in April hits approximately 12°C, and the average low end of the scale is around five °C (Environment and Climate Change Canada, 2021).
The geographical features, like the presence of Vancouver at the coast of the Pacific Ocean and within the reach of coastal mountain ranges, also have some influence on causing the observed weather patterns (Mekis, Eva et al., 80). The interplay between these geographical features and the regional circulation patterns and larger atmospheric patterns facilitated the formation and movement of weather systems, leading to changes in the area’s temperatures, precipitation and wind patterns. By highlighting the notable trends, assessing the possible reasons as to why they have arisen and comparing the findings to the prior recorded historical data and regional influences- this analysis sets the stage for the insightful exploration of the weather determining the atmosphere of Vancouver at the time.
Figure 1
Illustration
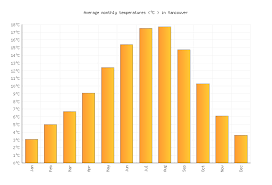
The bar graph represents the amount of precipitation that was recorded in Vancouver for the analyzed period from March 31 to April 4 in the year 2024. The table bar can be read as a daily precipitation amount of mm. 8.2 mm of rainfall was recorded on April 2, and this goes along with the tallest bar on the graph showing the difference between all the precipitation occurrences during the study period. The graph actually depicts a higher-than-average rainfall on that particular day compared to the moderate conditions on other dates.
Figure 2
Illustration
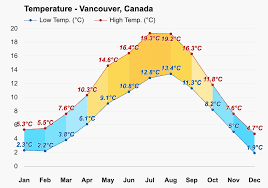
The graph above depicts a weather analysis for the period starting on the 35th of March and ending on April 4, 2024, referring to the boundaries of the early April temperature range. The fluctuations like the abatement to 9°C on April 3 after two consecutive days of 15°C are recorded for future analysis as well. These discrepancies are cornerstones necessary for comparison with the norm April temperatures. The analysis is made by observing the changing of temperature from winter to spring, with the graph’s rising minimum averages exactly from winter lows to the warmer spring through the March and April months. This imagery refers to the passage of winter into spring thereby demonstrating observing seasonal changes in this period. In addition, this work together seeks to address how climate factors such as observed weather link to local biodiversity and urban progress. The average temperature graph contains climatic context that would appear to be prevailing, which builds transitions between short-term weather events and the overall climate regime.
| Date | Temperature (°C) | Precipitation (mm) | Wind Speed (km/h) | Remarks |
| March 31 | 5 – 13 | 0 | – | Clear sky, warm temperatures with a high of 13°C |
| April 1 | 7 – 15 | 0 | – | Warm temperatures with a high of 15°C, clear sky |
| April 2 | 5 – 15 | 8.2 | – | Transition to rainy conditions with significant precipitation of 8.2 mm, cloudy skies |
| April 3 | 1 – 9 | – | Upto 35 | 40% chance of showers, windy conditions with gusts up to 35 km/h, low-pressure system approaching |
| April 4 | 2 – 12 | 0 | – | Return to a mixed climate with sun and clouds; temperatures increase to 12°C. |
Results and Discussion
With the end of the research period in sight (from March 31 to April 4, 2024) and looking back at the initial assumptions about weather conditions and the research questions that have guided the study, the results of the data analysis and graphical depictions have provided relevant insights into the weather pattern in Vancouver, during the time of the research. Where some elements align with the predicted models, other findings give a profound new research path. In this regard, one of the most critical tasks was expecting temperatures to increase gradually as spring moved by the traditional seasonal pattern. The information mainly appeared in this prediction as daily temperatures increased by about two °C between March 31 and April 1 and 2. However, the nine °C temperature drop on April 3 and the following rebound to 12°C on April 4 were in dispute with the predicted steady-state warming curve of dynamics in the atmosphere.
What is more, the precipitation data shows the deviation beyond historical bars. Even though Vancouver is known to receive relatively moderate precipitation in the spring, the recorded amount of 8.2 mm on April 2 is noteworthy since the average rainfall accumulated in April is approximately 60 mm, based on climate records as indicated by Environment and Climate Change Canada in 2021. It is essential to note the origin of such rapid precipitation, which can be traced to the movement of a weather system as satellite images and pressure maps show it on the ground. Through thorough inspection and analysis of the data, we are to reveal possible mistakes or variations in the solution. On April 3, there was not only a significant difference in the wind speed readings but also it was not recorded at all. During the night between February 15 and 16, YVR station registered gusts of 35 km/h, which indicates a moderately windy day.
Conclusion
The research of this weather system covered a comprehensive study of the weather conditions in Vancouver, BC, Canada, from March 31, 2024, till April 4, 2024. The most notable results were marked differences from the typical spring weather: a significant rainfall event on April 2 that defied the progressive temperature increase and global warming. Moreover, there were wind speed differences between the recorded wind speeds and anecdote reports, which uncovered limitations in data collection methods. These observations serve as the foundation for exploring how environmental variables, such as weather, could determine the success of local biodiversity and City planning. Allowing for temporary wastage of treatment and management systems and high-speed changes in temperature, which may affect vegetation growth and energy consumption, are also potential factors. To this end, the emergence of irregular clouds raises issues about the geographical aspects of the weather of a particular region, and this has many impacts that factor in urban planning and development.
Works Cited
Gultepe, Ismail, et al. “A review of high impact weather for aviation meteorology.” Pure and applied geophysics 176 (2019): 1869-1921. https://link.springer.com/article/10.1007/s00024-019-02168-6
Gultepe, Ismail, and Wayne F. Feltz. “Aviation meteorology: Observations and models. Introduction.” Pure and Applied Geophysics 176.5 (2019): 1863-1867. https://link.springer.com/article/10.1007/s00024-019-02188-2
Li, Yanping, et al. “High-resolution regional climate modelling and projection over western Canada using a weather research forecasting model with a pseudo-global warming approach.” Hydrology and Earth System Sciences 23.11 (2019): 4635–4659. https://hess.copernicus.org/articles/23/4635/2019/
Mekis, Eva, et al. “An overview of surface-based precipitation observations at environment and climate change Canada.” Atmosphere-Ocean 56.2 (2018): 71–95. https://research-groups.usask.ca/hydrology/documents/pubs/papers/kinar-n.j._pomeroy-j.w._2021_2.pdf
Tarbuck, Edward J., and Frederick K. Lutgens. The atmosphere: an introduction to meteorology. Prentice Hall, (1979): 1-1912 https://bpb-use1.wpmucdn.com/journeys.dartmouth.edu/dist/f/8272/files/2021/12/Meteorology-Textbook-compressed.pdf
 write
write