Abstract
The study’s primary interest was the relationship between CO2 concentrations and the increase in global temperatures. Two simple regression analyses were performed to assess the impact of CO2 concentrations on the Northern and Southern hemispheres’ temperatures. Temperature anomaly data was used because it indicates the deviation from the reference point and may show a rise or a fall. The analysis revealed that the results were statistically significant; Model 1:F(1,60)=467.9,p=0.000,r2=.8863 and Model 2:F(1,60)=356.9,p=0.000,r2=.8561(see Tables 2 and 3). Thus, the rise in CO2 concentration significantly increases temperatures in the Northern and Southern hemispheres.
Introduction
The causal relationship between CO2 concentrations and the temperature has been explored since the industrial revolution. The increasing concentrations of greenhouse gases such as CO2 in the atmosphere causes the earth’s climate system to retain more energy, leading to global warming (Verma, 2021; Mikhaylov et al., 2020). Since the industrial revolution, global temperature has increased due to high CO2 emissions, with the average rise from 1981 to 2019 being 0.17℃, and it was predicted to be 0.5℃ by 2020 (Yoro & Daramola, 2020). The increasing emission of large volumes of CO2 into the atmosphere has led to continuous projections that the global temperature is expected to rise with time. Although many researchers have explored the causes of temperature increase, the impact of climate change has led to collaborative efforts to reduce global warming.
The increasing CO2 concentrations and global temperature threaten human, animal, and plant life. Celik (2020) explained that climate change causes environmental problems associated with natural disasters such as floods and drought, leading to deaths, injuries, and homelessness. The researcher added that the increase in CO2 levels causes climate change, decreasing agricultural yields. Prakash (2021) asserted that the changes in water temperature might alter the normal functioning of aquatic animals, affecting their growth, distribution, and behavior. As such, assessing how CO2 concentration impacts global temperatures is necessary. The Northern hemisphere has a high land mass, implying a higher global population than the Southern hemisphere. Examining the impact of CO2 concentration on temperature levels in the two hemispheres would indicate the risk it imposes on inhabitants and show the need to adopt appropriate measures to reduce emissions. This study assessed the following hypotheses:
Hypothesis 1:
H01 : CO2 concentration does not affect Northern hemisphere temperature
Ha1 : CO2 concentration significantly affects Northern hemisphere temperature
Hypothesis 2:
H02 : CO2 concentration does not affect Southern hemisphere temperature
Ha2 : CO2 concentration significantly affects Southern hemisphere temperature
Methodology
Regression analysis was performed using the climate dataset to test hypotheses 1 and 2. The variables used in the study include CO2 concentration in parts per million (ppm), Southern hemisphere temperature anomaly, and Northern hemisphere temperature anomaly in degrees Celsius, which are numerical. The following regression models were estimated:
Model 1: NHT.Anom=β0+β1CO2+εi
Model 2: SHT.Anom=α0+α1CO2+εi
Results
Descriptive statistics were reported in Table 1 to summarize the data. Figures 1 and 2 were generated to assess regression assumptions. Regression analysis requires a preliminary analysis to determine whether error terms are statistically independent, have constant variance, and are normally distributed since violating these assumptions may yield biased and misleading forecasts (Flatt & Jacobs, 2019). The figures show that the two models meet regression assumptions and can be used to predict temperature anomalies.
Table 1: Descriptive statistics of the three variables
| CO2. ppm | NH. temp anomaly | SH. temp anomaly | |
| Mean | 356.39 | 0.39 | 0.30 |
| Median | 353.83 | 0.265 | 0.30 |
| Minimum | 315.98 | -0.21 | -0.20 |
| Maximum | 414.24 | 1.36 | 0.74 |
| Standard deviation | 29.11 | 0.424 | 0.239 |
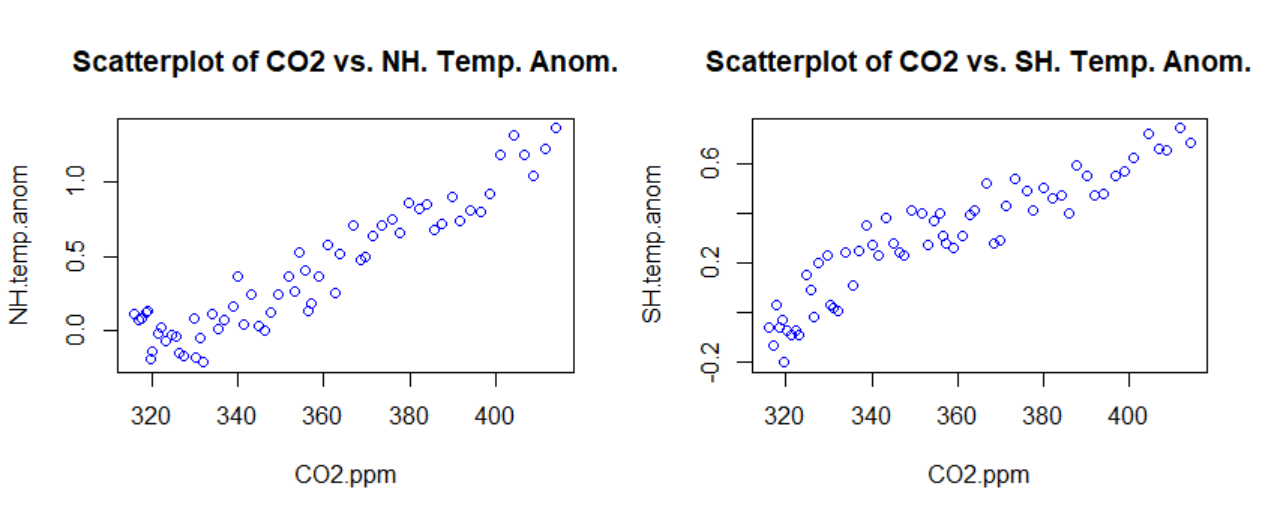
Figure 1: Scatterplots of CO2 concentration versus temperature anomalies in the northern and southern hemispheres.
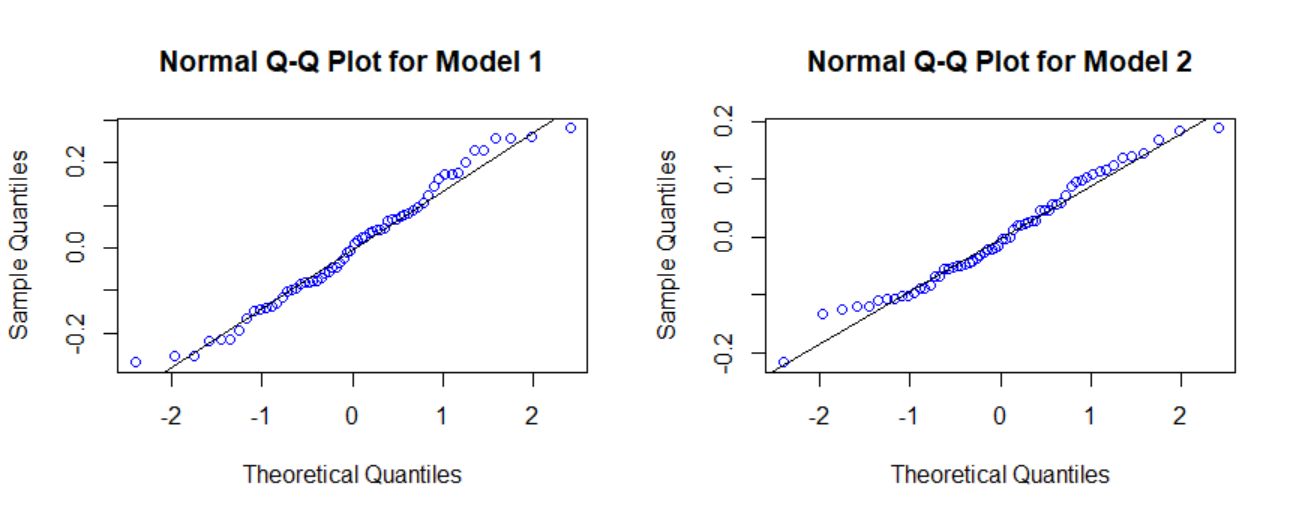
Figure 2: Normal probability plots for models 1 and 2
Table 2: Regression analysis results for Model 1
| Effect | Estimate | SE | t value | p |
| Intercept | -4.4931 | 0.2266 | -19.82 | 0.000 |
| CO2 Concentration | 0.01371 | 0.0006339 | 21.63 | 0.000 |
| R-squared | 0.8863 | |||
| Adjusted R-squared | 0.8845 | |||
| Residual SE | 0.1441 | |||
| F-statistic | 467.9 | 0.000 |
Table 3: Regression analysis results for Model 2
| Effect | Estimate | SE | t value | p |
| Intercept | -2.4114 | 0.1438 | -16.77 | 0.000 |
| CO2 Concentration | 0.007599 | 0.0004023 | 18.89 | 0.000 |
| R-squared | 0.8561 | |||
| Adjusted R-squared | 0.8537 | |||
| Residual SE | 0.09146 | |||
| F-statistic | 356.9 | 0.000 |
Discussion
The regression analyses performed showed significant results. The coefficient of determination shows the proportion of the variance in the response variable that the explanatory variables used in the model can predict (Chicco et al., 2021; Kim, 2019; Anastassopoulou et al., 2020). Table 2 shows that CO2 concentration explains about 88.63% of the variations in the Northern hemisphere temperature anomaly. Table 3 indicates that CO2 explains 85.61% of the Southern hemisphere temperature anomaly variations. Moreover, the F-statistics values and their corresponding p-values (Model 1:F(1,60)=467.9,p=0.000 and Model 2:F(1,60)=356.9,p=0.000) suggest that the two models significantly explain the variations in temperature anomaly in the Northern and Southern hemispheres. Thus, since the two models were statistically significant, the coefficients were examined to determine the impact of CO2 on temperature.
The coefficients indicate temperature anomaly that does not depend on CO2 concentration and CO2 impact. Temperature anomaly is the difference between the observed and the reference (long-term average) temperature level. When the value is positive, the observed temperature is above the reference point; otherwise, the observed temperature is lower (Tamarin-Brodsky et al., 2020). The negative intercepts (Model 1:β0=-4.493,and Model 2: α0=-2.4114) show the values by which the Northern and Southern hemispheres are cooler than the reference point if CO2 concentration is constant. The slope coefficients suggest that a unit increase in CO2 ppm increases the temperature in the Northern and Southern hemispheres by 0.01371℃ and 0.0076℃, respectively. The p-values corresponding to the slope coefficients are less than .05. Therefore, we conclude that CO2 concentration significantly increases temperatures in the Northern and Southern hemispheres.
Another issue that can be explored with the result is how the impact of CO2 concentration compares between the Northern and Southern hemispheres. Bulgin et al. (2020) explained that the Northern hemisphere often experiences stronger warming trends than the Southern hemisphere. Based on the results (in Tables 2 and 3), the average temperature anomaly in the Northern hemisphere (M = 0.39) is greater than that in the Southern hemisphere (M = 0.3). Moreover, the R-squared values suggest that CO2 concentration causes a larger increase in temperature anomaly in the Northern hemisphere (β1=0.01371) than in the Southern hemisphere (α1=0.0076). The result may support the argument but leaves a gap in determining whether the difference is significant.
Conclusion
The regression analyses suggest that CO2 concentration significantly increases temperatures in the Northern and Southern hemispheres. The Northern hemisphere tends to experience higher warming trends due to CO2 concentration than the Southern hemisphere. However, further research should determine whether the difference is significant.
References
Anastassopoulou, C., Russo, L., Tsakris, A., & Siettos, C. (2020). Data-based analysis, modelling and forecasting of the COVID-19 outbreak. PloS one, 15(3), e0230405. https://journals.plos.org/plosone/article?id=10.1371/journal.pone.0230405
Bulgin, C. E., Merchant, C. J., & Ferreira, D. (2020). Tendencies, variability and persistence of sea surface temperature anomalies. Scientific reports, 10(1), 7986. https://www.nature.com/articles/s41598-020-64785-9
Celik, S. (2020). The effects of climate change on human behaviors. Environment, climate, plant and vegetation growth, 577-589. https://www.researchgate.net/profile/Altaf-Lahori/publication/344491647_Promising_Technologies_for_Cd-Contaminated_Soils_Drawbacks_and_Possibilities/links/610665890c2bfa282a1355a7/Promising-Technologies-for-Cd-Contaminated-Soils-Drawbacks-and-Possibilities.pdf#page=591
Chicco, D., Warrens, M. J., & Jurman, G. (2021). The coefficient of determination R-squared is more informative than SMAPE, MAE, MAPE, MSE and RMSE in regression analysis evaluation. PeerJ Computer Science, 7, e623. https://peerj.com/articles/cs-623/
Flatt, C., & Jacobs, R. L. (2019). Principle assumptions of regression analysis: Testing, techniques, and statistical reporting of imperfect data sets. Advances in Developing Human Resources, 21(4), 484-502. https://www.researchgate.net/profile/Ronald-Jacobs/publication/335626297_Principle_Assumptions_of_Regression_Analysis_Testing_Techniques_and_Statistical_Reporting_of_Imperfect_Data_Sets/links/62c5c4708f4dd63324adb6c5/Principle-Assumptions-of-Regression-Analysis-Testing-Techniques-and-Statistical-Reporting-of-Imperfect-Data-Sets.pdf
Kim, J. H. (2019). Multicollinearity and misleading statistical results. Korean journal of anesthesiology, 72(6), 558-569. https://synapse.koreamed.org/articles/1156320
Mikhaylov, A., Moiseev, N., Aleshin, K., & Burkhardt, T. (2020). Global climate change and greenhouse effect. Entrepreneurship and Sustainability Issues, 7(4), 2897. http://doi.org/10.9770/jesi.2020.7.4(21)
Tamarin-Brodsky, T., Hodges, K., Hoskins, B. J., & Shepherd, T. G. (2020). Changes in Northern Hemisphere temperature variability shaped by regional warming patterns. Nature Geoscience, 13(6), 414-421. https://centaur.reading.ac.uk/89972/1/27743_2_merged_1582748121.pdf
Verma, A. K. (2021). Influence of climate change on balanced ecosystem, biodiversity and sustainable development: An overview. International Journal of Biological Innovations. https://doi.org/10.46505/IJBI.2021.3213
Yoro, K. O., & Daramola, M. O. (2020). CO2 emission sources, greenhouse gases, and the global warming effect. In Advances in carbon capture (pp. 3-28). Woodhead Publishing. https://www.researchgate.net/profile/Kelvin-Yoro/publication/343508726_CO2_emission_sources_greenhouse_gases_and_the_global_warming_effect/links/5f44aa2692851cd30227cffd/CO2-emission-sources-greenhouse-gases-and-the-global-warming-effect.pdf
Appendix
R-codes
Data = read.csv(file = “climate_data.csv”)
head(Data)
###Descriptive statistics
library(pastecs)
stat.desc(Data)
stat.desc(Data$CO2.ppm)
stat.desc(Data$NH.temp.anom)
stat.desc(Data$SH.temp.anom)
###Constructing scatterplots
par(mfrow=c(1,2))
plot(CO2.ppm,NH.temp.anom,main = “Scatterplot of CO2 vs. NH. Temp. Anom.”,col=”blue”)
plot(CO2.ppm,SH.temp.anom,main = “Scatterplot of CO2 vs. SH. Temp. Anom.”,col=”blue”)
##Regressing Northern hemisphere temperature anomaly on CO2 concentration
Model1 = lm(NH.temp.anom~CO2.ppm, data = Data)
summary(Model1)
res= resid(Model1)
qqnorm(res, main = “Normal Q-Q Plot for Model 1”,col = “blue”)
qqline(res)
##Regressing Southern hemisphere temperature anomaly on CO2 concentration
Model2 = lm(SH.temp.anom~CO2.ppm, data = Data)
summary(Model2)
res1= resid(Model2)
qqnorm(res1,main=”Normal Q-Q Plot for Model 2″, col = “blue”)
qqline(res1)
 write
write