Purpose of Experiment
This experiment aims to test a Francis turbine with a fixed head and obtain numerical data related to its efficiency, output, and vane opening. The nominal values of discharge and output are then determined to establish operating curves.
Theory
The Francis is a type of hydroelectric power generator. It converts the flowing water’s potential energy into mechanical power. It features a runner with curved vanes and a shaft that drives its generator.
The power output and efficiency of a hydraulic turbine are affected by various factors. Some of these include the water’s flow rate, its height, the opening of the vanes, and the speed of the turbine. The head of water determines the energy the turbine can use. The flow rate is the volume of water that flows through the turbine at a given rate.
The efficiency of a hydraulic turbine is a measure of how much power it produces when compared to its input. It can be affected by various factors, such as leakage, turbulence, and friction. The power output of a turbine is mainly attributed to its rotational speed and torque. Water’s head and flow rate are also considered to determine its torque.
The Francis test analyzes a turbine’s power output and vane opening characteristics. It can also determine its efficiency. This method involves plotting the variables’ values on curves, which can then be used to establish operating curves. The operating curves show the vane opening and the turbine’s power output. These curves can be utilized to determine the ideal conditions for the operation of a turbine, which can help optimize its efficiency and power output. This information can be useful in designing and operating a hydroelectric power plant.
The power output of a Francis turbine can be calculated using the following equation:
P = ρQHη
The power output of a device is measured by comparing its output with the density of water in its kg/m3. The head H measures the turbine’s efficiency, while the Q is the volume of flowing water. A flow meter can determine the flow rate, while a pressure transducer can measure the head H.
The following equation gives the efficiency of the turbine:
η = Pout / Pin
The input power of a device is represented by the Pin, while the Pout represents the output power. In the case of a Francis turbine, the input power Pin can be expressed as:
Pin = ρQHg
Where; g is the acceleration due to gravity (9.81 m/s^2). Therefore, the efficiency can also be expressed as:
η = Pout / (ρQHg)
In addition to the above equations, the power output of the turbine can be related to its rotational speed (RPM) using the following equation:
P = 2πNT / 60
The power output of a device is represented by the watts. The rotational speed of the device is represented by the N, while the torque is represented by the T. The torque can be determined by measuring the force on the turbine blades and the radius of the turbine runner.
The efficiency of a Francis turbine is influenced by various factors, such as the design and quality of its components. The most common causes of these losses are frictional issues in the seals and bearings, flow separation, and turbulence. It is possible to improve the efficiency of a turbine by analyzing its performance in different operating conditions.
Procedure
Apparatus
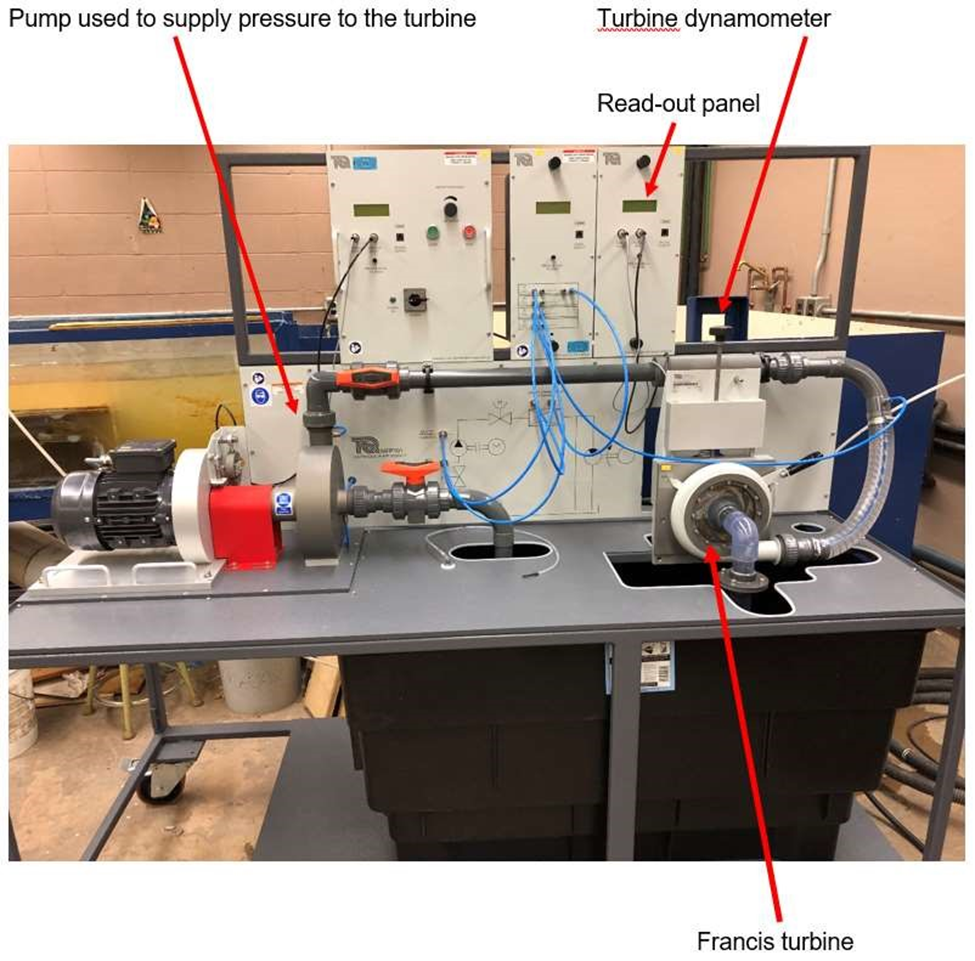
Figure 1 Set Up
Procedure
- The elbow and pipe were removed from the water exit, which had been in place for the pump lab, and the turbine inlet adapter was installed (as seen in FIG.5). For instance, the guide vane of the Francis turbine was adjusted to a full open position.
- The delivery and pump inlet valves were opened.
- The Turbine Dynamometer’s torque adjustment control was removed so the band brake could be loose. The back of the device was also checked to ensure the brake was properly fitted.
- The device’s side was gently tapped. Then, the button was held, and the torque was set to zero.
- Rrpm control knob was turned until a turbine inlet pressure of approximately 90% of the maximum (p3 =.73 bars ± 2) was achieved. The turbine started turning.
- The torque of the Turbine Dynamometer was slowly adjusted using the tensioning knob while keeping the turbine inlet pressure (p3) at 0.73 bars to set the turbine rpm to the first rpm on the data sheet (1800 ± 20). If the turbine inlet pressure dropped, the pump motor rpms were increased. All pressure lines were purged as in the pump lab.
- Δp1, p3, the turbine shaft power output (read from the panel), and the turbine rpm were recorded.
- Steps 6 and 7 were repeated until all the rpms for 100% were completed.
- Steps 6 to 8 were repeated at 75%, 50%, and 25% of turbine vane openings.
Results
Table 1 Table of all Calculated Values – Turbine
| Guide
Vane Openings % |
Turbine
RPM ± 20 |
P3
(±0.02 bars) |
ΔP1
(bars) |
Turbine
Shaft Power Output WTS (Watts) |
ΔP1
(Pa) |
P3
(Pa) |
Qv (m3/s) | Input power from the pump
WTH=Qv*P3 (W) |
Efficiency (%) (WTS / WTH) x100 |
| 100 | 1800 | 0.73 | 0.25 | 64 | 25000 | 73000 | 0.002295 | 167.5535 | 38.19677 |
| 1600 | 0.73 | 0.33 | 97 | 33000 | 73000 | 0.002637 | 192.5043 | 50.3885 | |
| 1400 | 0.73 | 0.34 | 96 | 34000 | 73000 | 0.002677 | 195.3992 | 49.13018 | |
| 1200 | 0.73 | 0.35 | 91 | 35000 | 73000 | 0.002716 | 198.2519 | 45.9012 | |
| 1000 | 0.73 | 0.35 | 80 | 35000 | 73000 | 0.002716 | 198.2519 | 40.3527 | |
| 800 | 0.73 | 0.35 | 66 | 35000 | 73000 | 0.002716 | 198.2519 | 33.29098 | |
| 600 | 0.73 | 0.32 | 48 | 32000 | 73000 | 0.002597 | 189.5651 | 25.32112 | |
| 75 | 1800 | 0.73 | 0.22 | 58 | 22000 | 73000 | 0.002153 | 157.1791 | 36.90059 |
| 1600 | 0.73 | 0.26 | 76 | 26000 | 73000 | 0.002341 | 170.8717 | 44.47782 | |
| 1400 | 0.73 | 0.31 | 90 | 31000 | 73000 | 0.002556 | 186.5796 | 48.23678 | |
| 1200 | 0.73 | 0.31 | 83 | 31000 | 73000 | 0.002556 | 186.5796 | 44.48503 | |
| 1000 | 0.73 | 0.32 | 74 | 32000 | 73000 | 0.002597 | 189.5651 | 39.03672 | |
| 800 | 0.73 | 0.31 | 61 | 31000 | 73000 | 0.002556 | 186.5796 | 32.69382 | |
| 600 | 0.73 | 0.31 | 47 | 31000 | 73000 | 0.002556 | 186.5796 | 25.19032 | |
| 50 | 1700 | 0.73 | 0.19 | 52 | 19000 | 73000 | 0.002001 | 146.0697 | 35.59944 |
| 1600 | 0.73 | 0.21 | 58 | 21000 | 73000 | 0.002104 | 153.5653 | 37.76896 | |
| 1500 | 0.73 | 0.21 | 60 | 21000 | 73000 | 0.002104 | 153.5653 | 39.07133 | |
| 1400 | 0.73 | 0.25 | 73 | 25000 | 73000 | 0.002295 | 167.5535 | 43.56819 | |
| 1200 | 0.73 | 0.25 | 69 | 25000 | 73000 | 0.002295 | 167.5535 | 41.18089 | |
| 1000 | 0.73 | 0.25 | 61 | 25000 | 73000 | 0.002295 | 167.5535 | 36.40629 | |
| 800 | 0.73 | 0.25 | 52 | 25000 | 73000 | 0.002295 | 167.5535 | 31.03487 | |
| 600 | 0.73 | 0.25 | 40 | 25000 | 73000 | 0.002295 | 167.5535 | 23.87298 | |
| 25 | 1500 | 0.73 | 0.15 | 35 | 15000 | 73000 | 0.001778 | 129.7863 | 26.9674 |
| 1400 | 0.73 | 0.15 | 36 | 15000 | 73000 | 0.001778 | 129.7863 | 27.73789 | |
| 1300 | 0.73 | 0.17 | 44 | 17000 | 73000 | 0.001893 | 138.1681 | 31.84526 | |
| 1200 | 0.73 | 0.17 | 40 | 17000 | 73000 | 0.001893 | 138.1681 | 28.95024 | |
| 1100 | 0.73 | 0.18 | 42 | 18000 | 73000 | 0.001948 | 142.1738 | 29.5413 | |
| 1000 | 0.73 | 0.18 | 40 | 18000 | 73000 | 0.001948 | 142.1738 | 28.13458 | |
| 900 | 0.73 | 0.18 | 39 | 18000 | 73000 | 0.001948 | 142.1738 | 27.43121 | |
| 800 | 0.73 | 0.19 | 36 | 19000 | 73000 | 0.002001 | 146.0697 | 24.64577 | |
| 700 | 0.73 | 0.19 | 31 | 19000 | 73000 | 0.002001 | 146.0697 | 21.22274 | |
| 600 | 0.73 | 0.18 | 28 | 18000 | 73000 | 0.001948 | 142.1738 | 19.6942 |
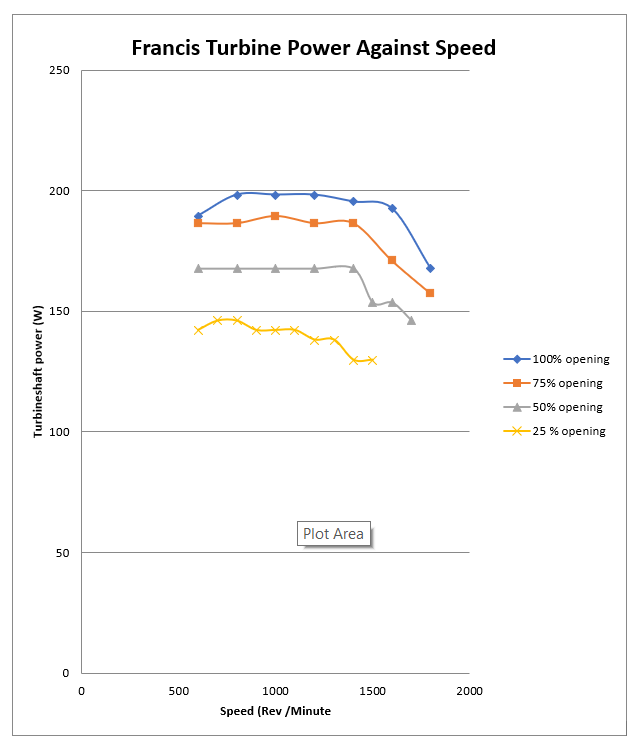
Figure 2
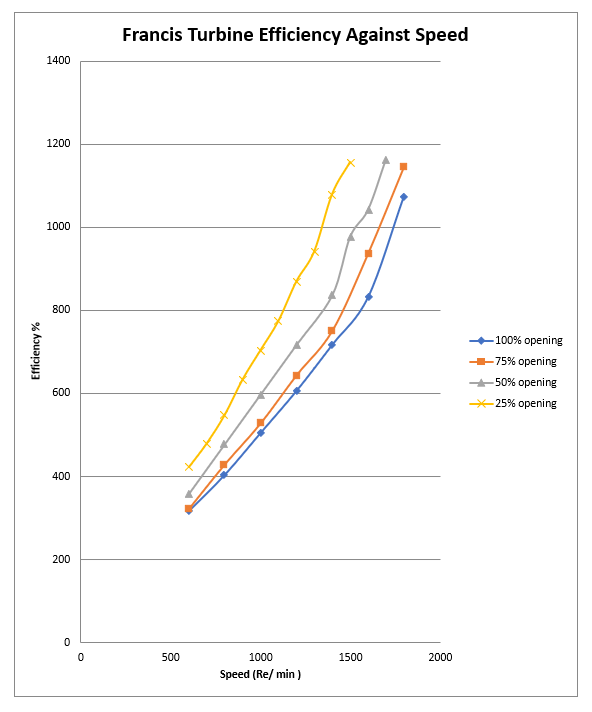
Figure 3
Discussion
We tested a Francis turbine with a fixed head and obtained various curves related to its efficiency, power output, and vane opening. The nominal values of discharge and output were also established. The results indicated that the vane opening of the turbine shaft greatly affects its efficiency. A unit’s efficiency and power output were higher when it was at 100% open than when it was at 25% open. This is because the flow at the lower vane openings is less than at, the higher openings.
The results of the study revealed that the rpm of the turbine shaft has a significant impact on its efficiency. As the rpm increases, the unit’s efficiency decreases, and the shaft power increases. This is because the turbine experiences higher losses, which leads to a reduction in efficiency. On the other hand, the increase in rpm resulted in a power output increase. The lines connecting the high and low rpm components eventually drop off, which indicates that the turbine is not operating at its design capacity. This issue could cause it to experience losses, leading to lower power output and efficiency.
Conclusion
The results of the Francis turbine test revealed that the relationship between the power output, rpm, efficiency, and vane opening could be explained by the various factors that affect its operation. The data collected during the experiment were then used to generate different power outputs against different speed curves for the different openings in the vane. The variations in supply voltage can affect the accuracy of data collected during the experiment. Also, minor deviations in readings during the study can contribute to the uncertainty in results. Overall, the data collected during the experiment support the assumption that the power output and efficiency of the Francis turbine can be directly related to the rpm and vane opening. In future tests, it’s important to identify the sources of error and improve the efficiency of the power output by implementing more precise instruments.
References
Noon, A. A., & Kim, M. H. (2021). Review of latest experimental and numerical sediment and cavitation erosion techniques in Francis turbines. Energies, 14(6), 1516. https://www.mdpi.com/1996-1073/14/6/1516/pdf
Presas, A., Luo, Y., Wang, Z., & Guo, B. (2019). Fatigue life estimation of Francis turbines based on experimental strain measurements: Review the actual data and future trends. Renewable and Sustainable Energy Reviews, 102, 96-110. https://upcommons.upc.edu/bitstream/handle/2117/175488/pagination_RSER_8826.pdf?sequence=1
Unterluggauer, J., Sulzgruber, V., Doujak, E., & Bauer, C. (2020). Experimental and numerical study of a prototype Francis turbine startup. Renewable Energy, 157, 1212-1221. https://www.sciencedirect.com/science/article/pii/S0960148120306947
Zhou, X., Wu, H. G., & Shi, C. Z. (2019). Numerical and experimental investigation of the effect of baffles on flow instabilities in a Francis turbine draft tube under partial load conditions. Advances in Mechanical Engineering, 11(1), 1687814018824468. https://journals.sagepub.com/doi/pdf/10.1177/1687814018824468
 write
write