Introduction
To satisfy the lecturer, I initially meticulously assessed and published class marks using Excel for data manipulation and statistical analysis. The following phases clarify the study’s reasoning, the options explored, and the recommended solution. The project allows me to practice and enhance my course abilities by analyzing a real-world situation with statistics and Excel. In addition to the Excel analysis, this document outlines the process for finding the released solutions.
Steps Taken:
Data Entry: The first step was to enter student information into an Excel spreadsheet. This file contained first and last names, student numbers, and grades for assignments, midterms, and final exams. The data is organized to facilitate browsing and calculation. We must be cautious at this critical stage of the analysis process to avoid costly errors.
Sorting by Alphabetical Order: To improve organization, I sorted the data by students’ first names. This is accomplished using Excel’s sort tool in the Home tab. After that, I chose the first name column and used the expansion tool to broaden my selection to sort the entire data set. This phase will make it easy to analyze and report the results.
Weighted Marks Calculation: To generate weighted marks, I multiplied the percentage scores for assignments, midterms, and finals by their weights. The weighted marks for the students’ three tests are now displayed in new columns. This method was created to demonstrate each student’s performance.
Total Marks Computation: I then added the weighted marks to determine each student’s overall grade. To deliver complete points. I said each student’s weighted assignment, midterm, and final test scores. Exam weights are factored into this sum to assess academic advancement.
Using VLOOKUP in Excel to Implement the Grading System: I rated pupils using Excel’s VLOOKUP tool and the grading scheme supplied. The VLOOKUP formula can be used to arrange grades, retrieve grades from another sheet, and automate assignment grades. The function sets the grades column and awards grades using my Excel grading system (Murray, 329). It determines the closest match between the criteria.
Counting Grades with COUNTIF: COUNTIF for grade counting COUNTIF was used to compute the grade distribution. I assessed the prevalence of different performance levels in the class by numbering each grade group. I investigated grade distribution by generating summary descriptive statistics and displaying charts, which assisted me in concluding the course and students.
Percentage Calculation: The proportion of each grade category was obtained by dividing the total number of students by the number of pupils in each grade. This step displays the normalized grade distribution, which facilitates category comparisons.
Incorporating a Histogram: I created a histogram chart to demonstrate grade distribution. The histogram displays the number and percentage of students in each grade level.
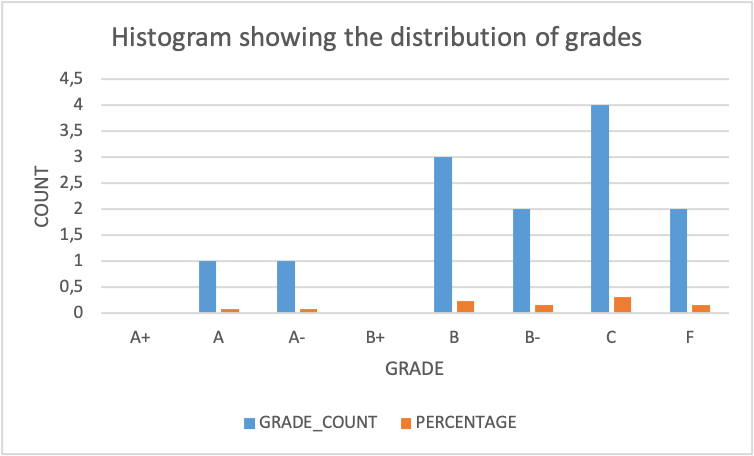
Figure 1: Histogram showing the distribution of grades.
| GRADE_COUNT | PERCENTAGE | ||
| Mean | 1.625 | Mean | 0.125 |
| Standard Error | 0.497762852 | Standard Error | 0.03828945 |
| Median | 1.5 | Median | 0.115384615 |
| Mode | 0 | Mode | 0 |
| Standard Deviation | 1.407885953 | Standard Deviation | 0.108298919 |
| Sample Variance | 1.982142857 | Sample Variance | 0.011728656 |
| Kurtosis | -0.564499635 | Kurtosis | -0.564499635 |
| Skewness | 0.479922166 | Skewness | 0.479922166 |
| Range | 4 | Range | 0.307692308 |
| Minimum | 0 | Minimum | 0 |
| Maximum | 4 | Maximum | 0.307692308 |
| Sum | 13 | Sum | 1 |
| Count | 8 | Count | 8 |
| Confidence Level(95.0%) | 1.177022112 | Confidence Level(95.0%) | 0.090540162 |
Table 1: Summary statistics for the distribution of grades.
Summary Statistics Calculation:
I calculated summary statistics such as the mean, median, mode, standard deviation, and quartiles to comprehend test scores better. These metrics indicate the core tendency and variability of the dataset (Amrhein, 262). The table below summarizes the descriptive information for the thirteen students’ grade distribution.
| TOTAL_WEIGHTED_MARKS | |
| Mean | 70.52692308 |
| Standard Error | 2.456921251 |
| Median | 70.55 |
| Mode | #N/A |
| Standard Deviation | 8.858555549 |
| Sample Variance | 78.47400641 |
| Kurtosis | 0.058077318 |
| Skewness | 0.004300945 |
| Range | 32.1 |
| Minimum | 54.65 |
| Maximum | 86.75 |
| Sum | 916.85 |
| Count | 13 |
| Confidence Level(95.0%) | 5.353171542 |
Table 2: Summary statistics for the total weighted marks
Decision-Making Process:
Summary Statistics for Total Weighted Marks:
A mean score of 70.53: The mean total weighted marks connect with the average performance of all students. With a mean score of 70.53, overall performance is excellent. The grading system, however, assigns this a B-, which is mediocre.
The standard deviation is 8.86.: The 8.86 standard deviation indicates the entire weighted mark variability. Class performance may vary more if the standard deviation is more significant. The standard deviation was eight points, showing that the student performed realistically. This view is supported by the students’ different talents, which result in diverse presentations.
The range: The range of 32.1, which represents the difference between the lowest and highest total weighted marks, demonstrates that student performance varies substantially.
Range, skewness and distribution of marks
The minimum total weighted grade for a class performance is 54.65. The best individual success in the class is 86.75 total weighted scores. The skewness score supports this deviation of pupils’ grades in describing their mark distribution. Marks with a skewness of 0.0043 are statistically insignificantly positive. We decided that the kids’ performance variance was normal.
Rationale for Utilizing Total Weighted Marks Statistics:
The total weighted scores provide a comprehensive view of class achievement. The mean, standard deviation, range, lowest, and maximum statistics reflect student performance’s central trend and variability. The professor can use this information to analyze class performance, identify areas for improvement, and make informed decisions about teaching methods and interventions.
Implications for the Class:
Class performance is excellent, as evidenced by the high mean total weighted marks. This indicates that students perform well on assignments, midterms, and finals. Regarding the grading system, the standard score is B-, reflecting average achievement.
The significant standard deviation and range imply that student performance varies significantly. This demonstrates that, while average performance is outstanding, individual triumphs differ. The minimum and maximum total weighted marks represent the lowest and highest scores in the class (Enders, 79). Based on the skewness, we can deduce that the professor’s students’ performance is appropriate and normal.
Finally, the overall weighted marks provide a comprehensive view of class achievement. The high mean indicates overall performance, whereas the standard deviation and range highlight individual accomplishments. These insights enable the instructor to make educated decisions about future teaching tactics and interventions to ensure student success.
Work Cited
Amrhein, Valentin, David Trafimow, and Sander Greenland. “Inferential statistics as descriptive statistics: There is no replication crisis if we don’t expect replication.” The American Statistician 73.sup1 (2019): 262-270. https://www.tandfonline.com/doi/full/10.1080/00031305.2018.1543137
Enders, Craig K. Applied missing data analysis. Guilford Publications, 2022. https://www.guilford.com/books/Applied-Missing-Data-Analysis/Craig-Enders/9781462549863
Murray, Alan. “The Infamous VLOOKUP Function.” Advanced Excel Formulas: Unleashing Brilliance with Excel Formulas. Berkeley, CA: Apress, 2022. 329-372. https://link.springer.com/book/10.1007/978-1-4842-7125-4
 write
write