Following COVID, Huntsville, Alabama, experienced a housing crisis that created serious problems for the city’s property values, income distribution, rates of poverty, and housing occupancy. This study explores 2015–2022, looking at many aspects that have contributed to the issue in Morgan County, Madison County, and Limestone County, all adjacent to Huntsville.
Property Prices
Huntsville’s real estate values saw a noticeable uptrend between 2015 and 2022. Local real estate websites report that the median price of real estate increased to previously unheard-of heights. Madison County, which reported 169,820 housing units overall in the 2020 Decennial Census, experienced a significant demand rise, contributing to the rising cost of real estate.

Figure 1: The trend in property prices in Huntsville and Madison County from 2010 to 2021.
Income Levels
Analyzing income distribution is essential to comprehending the housing situation. Madison County’s median household income of $80,123 was recorded by the American Community Survey in 2022, suggesting a very affluent area (Bureau, 2023). However, citizens’ struggles with affordability are also caused by sluggish income growth over time.
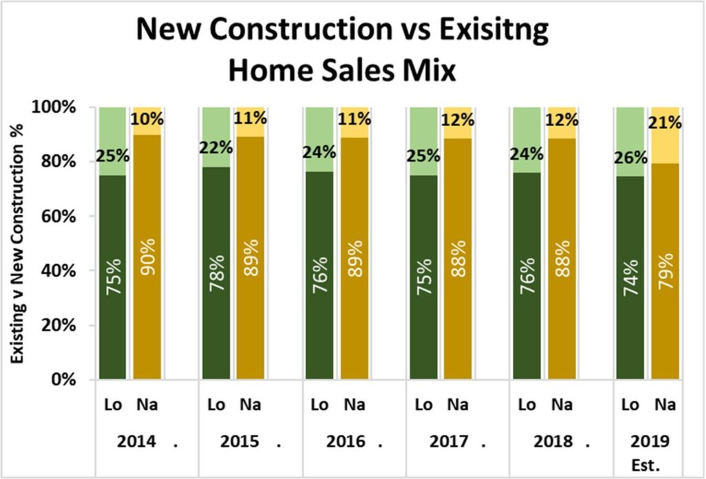
Figure 2: Comparative graph of median household income in Huntsville, Madison County, Limestone County, and Morgan County.
Poverty Rates
Huntsville’s economic progress has kept the city’s poverty statistics from changing. Variations in poverty rates have been caused by economic changes, especially during the COVID-19 pandemic. These changes have affected employment. The data from the U.S. Census Bureau emphasizes the need for a comprehensive strategy to address housing issues associated with poverty (Bureau, 2021).
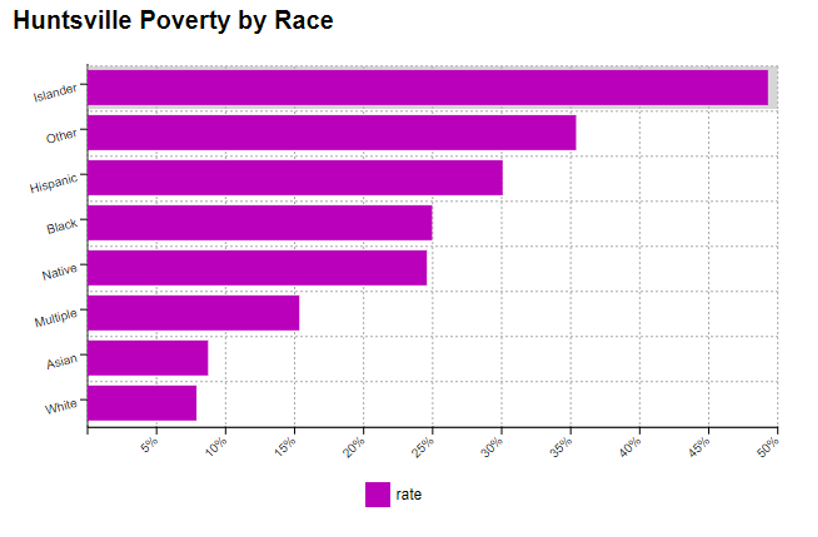
Figure 3: Poverty rates in Huntsville and surrounding counties from 2015 to 2022.
Despite the increase, Huntsville’s total poverty rate in 2022—14.62%—reflects economic difficulties. With a poverty rate of 16.73% for women and 12.34% for men, gender differences still exist. There are notable differences in poverty rates by race, with Islanders experiencing 49.29% poverty and White people 7.89%. Employment status further exacerbates disparities, which indicates 3.23% for full-time employees, 20.89% for part-timers, and 20.61% for non-workers—the economic effects of the COVID era demand that the region’s housing problems be approached with complexity.
Housing Occupancy
Migration patterns and population growth greatly impact housing occupancy. Occupancy trends in housing reflect shifts in housing demand, migration trends, and population expansion. According to census statistics and reports from local housing agencies, an increase in housing demand is exceeding availability. As a result, there is now more competition, greater pricing, and less affordable housing.
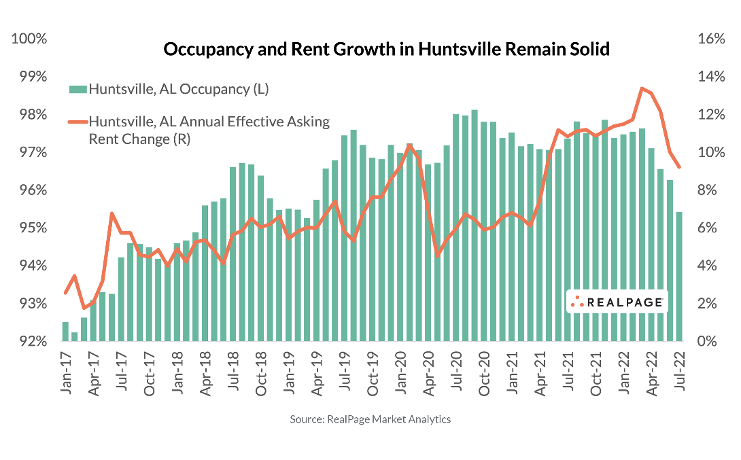
Figure 4: Housing occupancy trends in Huntsville and neighboring counties.
Affordability
One of the primary concerns in the housing crisis is affordability. The mismatch between relatively stable salaries and rising property prices restricts the availability of affordable housing. Research from housing advocacy organizations highlights the necessity of focused initiatives to address affordability issues.
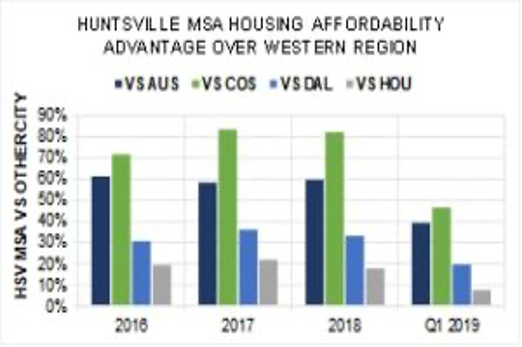
Figure 5: Affordability index in Huntsville compared to state and national averages.
Income Disparities
The affordability of housing is greatly impacted by income inequality. The housing problem worsens for low- and middle-income people because they need help finding affordable home options. The necessity for focused strategies to bridge these gaps and provide equitable housing possibilities is highlighted by data on income distribution.
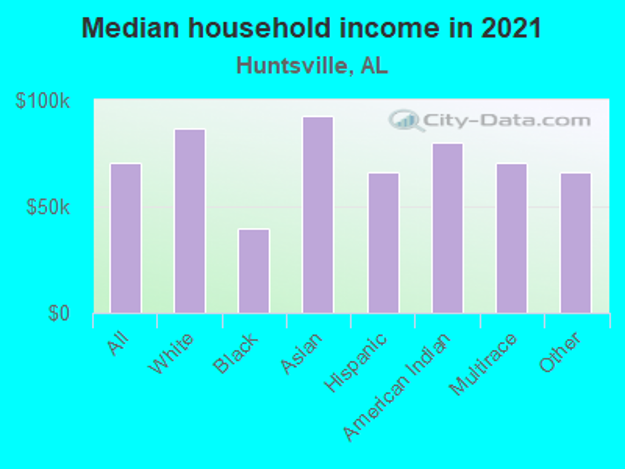
Figure 6: Distribution of income levels in Huntsville.
Racial Disparities
Demographic data clearly show how race affects housing inequality. It is essential to examine racial demography, prejudice, and housing opportunities. Census information and fair housing reports can illuminate the connections between race and Huntsville’s housing crisis.
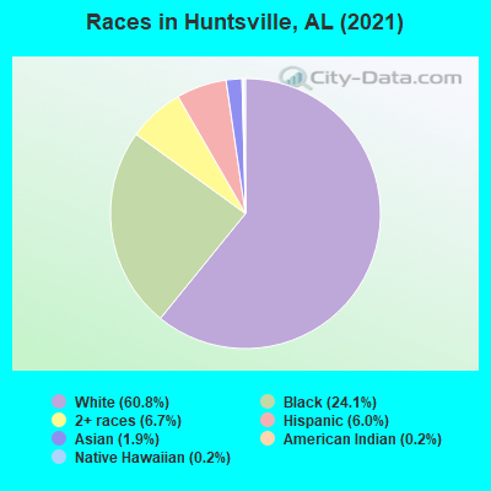
Figure 7: Racial demographics and housing disparities in Huntsville.
Housing G.I.S. Census Tracts
Understanding geographic distribution is essential to comprehending the housing situation. Particular G.I.S. census tracts in Morgan, Limestone, and Madison counties shed light on opportunities and difficulties that are unique to the area. Understanding the spatial dimensions of the housing issue can inform targeted interventions and policy choices.
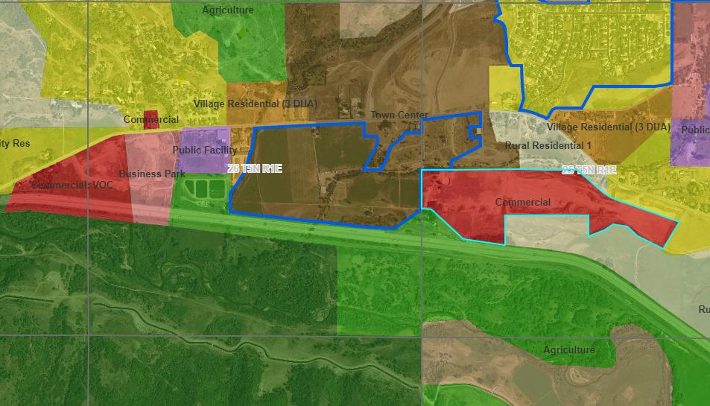
Figure 8: G.I.S. map depicting Madison County, Limestone County, and Morgan County housing conditions.
In conclusion, the post-COVID housing crisis in Huntsville, Alabama, is complex. Several interrelated factors, including housing occupancy, income levels, property prices, and poverty rates, add to the area’s difficulties. A comprehensive strategy is needed to address these problems, considering the physical, economic, and demographic dimensions of the housing crisis in Huntsville and the surrounding counties.
References
Huntsville, Alabama. Huntsville, Alabama (A.L.) profile: population, maps, real estate, averages, homes, statistics, relocation, travel, jobs, hospitals, schools, crime, moving, houses, news, sex offenders. (n.d.). https://www.city-data.com/city/Huntsville-Alabama.html
Bureau, U. C. (2021, November 22). About income & poverty. Census.gov. https://www.census.gov/topics/income-poverty/about.html
Publisher, T. C. J. this. (2023, March 30). The Morgan County News: March 31, 2023. Issuu. https://issuu.com/mycityjournals/docs/cym-2023-03-30_web
Bureau, U. C. (2023, October 25). American Community Survey (A.C.S.). Census.gov. https://www.census.gov/programs-surveys/acs#:~:text=The%20American%20Community%20Survey%20estimates,84.1%25%20as%20much%20as%20men.&text=In%202022%2C%20there%20were%20764%2C521,to%20the%20American%20Community%20Survey.
 write
write