Abstract
Technological advancements are seen in the modern world resulting from creativity among individuals worldwide. Creativity is an essential human factor in development in every sector. Human development is measured in three aspects, namely, social, economic, and political aspects. However, achieving an ultimate result in the three elements requires creativity within individuals. Creativity has resulted in various technological advancements in crucial sectors such as health, industrial production, and agriculture. The internet and social media have resulted in a global village where people interact freely regardless of ethnicity, geographical location, or culture. The role of art and creativity has extended to the educational sector to improve the quality of classroom learning and research. The introduction of technology in learning is one of the advancements in the education sector to aid teaching and learning processes. Using computers, which are products of creativity, has facilitated quality education through various learning aids available through online sources. The study aims at finding out the effects of ethnicity, education, and level of income on creative-based activities. Creative based-based activities herein include both educational-based and art-based creativities among human beings. The study involves an analysis of online data set presented by Art Midwest and a Metropolitan group on specific states in the US.
Introduction
Human creativity cut across all industries worldwide, which are increasingly becoming productive. Starting with the healthcare sector, the invention of health technologies such as electronic health records (EHR), magnetic resonance imaging (MRI), and chemotherapy are among health improvements that have greatly increased life expectancy among individuals. Creativity has presented an array for integrating scientific approaches to medicine and alternative medicine such as yoga, acupuncture, meditation, cupping, and herbal treatments to achieve an ultimate healthcare outcome. Evidence-based practices show positive results in integrating pharmaceutical treatments with alternative medicines for patients suffering from chronic infections and diet-related diseases such as obesity. Therefore, art and creativity are becoming important in improving health quality.
Similarly, the transport and communication industries have also grown tremendously due to inventions from various creative minds. Unlike informal transport and communication, the 21st century is characterized by great innovations such as electric trains, airplanes, cellphones, the internet, and other advancements within the sectors. The concept of globalization is achieved through creativity seen in the communication sector (Christian & Scott, 2022). The internet and social media have resulted in a global village where people interact freely regardless of ethnicity, geographical location, or culture. The role of art and creativity has extended to the educational sector to improve the quality of classroom learning and research. The introduction of technology in learning is one of the advancements in the education sector to aid teaching and learning processes. Using computers, which are products of creativity, has facilitated quality education through various learning aids available through online sources.
Regardless of the uncountable benefits of creative-based actions to the world’s growth, grassroots support for upcoming creative minds is limited. Governments in different countries are not implementing appropriate measures to promote creativity among pupils and students. The argument is based on the educational curriculum adopted in some countries, which is only based on theories rather than practical. Most institutions around the world are grounded on theoretical learning. For example, several institutions are currently offering online courses, including those for technical and functional subjects. In such cases, learners may not develop the required practical skills for improving their creativity towards using their careers to make the world a better place. The educational stakeholders are also not availing of the resources necessary for promoting art and creativity among learners. The argument brings us to the factors influencing creativity, especially among children (Kassymova et al., 2019). Since the essential element in art and invention is the availability of resources, it is evident that children from low-income backgrounds and unexposed ethnicities may have reduced creativity.
Many researchers have presented different arguments on the influence of factors such as income and culture on creativity. According to Shaw and Sullivan (2011), racial characteristics are witnessed among Latino and Blacks who participate less in art and creativity compared to whites due to lack of exposure. The main question here is, why are blacks and Latinos feel uncomfortable participating in public events related to art? The answer to this question may be associated with ethical practices. Whites are known to promote and support children’s talents and abilities from a younger age, which is not true for most blacks and Latinos. As a result, the children may not value co-curriculum activities, which are believed to be major contributors to creativity in art. Adams (2017) also presents the impact of artificial intelligence on human creativity in the modern world. Children exposed to artificial intelligence, such as communication and gaming gadgets, stand better at developing creativity than the unexposed. Bakas et al. (2019) argue that creative tourism activities in small-scale cities and rural areas are integrated into different ways, positively influencing the level of creativity among the participants. The finding is supported by Christian and Scott (2022), who mentioned that whites are the leading in attending creative tourism, followed by Latinos, and lastly, the Blacks. The study was based on the attendance of Bankhead National Forest and Sipsey Wilderness Area.
My research questions for the projects are: is there any connection between ethnicity and economic class in education-based creativity? And what are the effects of technological exposure on creativity? My research hypothesis is: that there is a connection between race, income, and creativity, and education influences individuals’ perception of creative art participation. My null hypothesis is: that there is no connection between ethnicity, revenue, and creativity, and level of education does not influence individuals’ perception of creative art participation.
Methods
I used an online data set collected by a non-profit group called Art Midwest and a Metropolitan group situated on the outskirts of Minneapolis. According to Arts Midwest & Metropolitan Group (2017), the two groups are working to achieve social change among various ethnicities within the region. The data set is “Creating Connections: Building Public Will for Arts and Culture. According to the information recorded by Arts Midwest and Metropolitan Group (2017), the data was collected in September 2014 using web-based surveys and telephone interviews. There was no face-to-face meeting with participants since the study was online and by phone. Samples from different states in the US were collected during the study. A total of 2 586 samples were collected from the states. The specific locations for the samples included Michigan, Oregon, Minnesota, California, and San Jose. After analyzing the data presented by the study, I decided to use about five variables. The five variables I chose included ethnicity, level of income, creativity, level of education, and perception of individuals on creative art. My independent variables (IV) were ethnicity, education, and income status, while dependent variables (DV) love creativity and the perception of individuals on creativity. I chose to race, education, and income level as the IV since they are not affected by other variables. Besides, the IV involves the other two variables; hence, I categorized them as DV.
Ethnicity was my first independent variable considered nominal data since it is a noun with general categorization. Under the variable, I analyzed different ethnicities used in the study, and they included Native Indian American, Asian, Black, Latino, Native Hawaiian, White, Multiracial, other, and I don’t know. For convenience and ease, I removed the category “other” while handling the data by marking it as missing to allow for easy analysis of multiracial data. Ethnicity and IV entailed all these racial subcategories, implying that the researchers used a large sample size during their investigation. Also, they selected the most affected ethnicities in the regions as far as the topic is concerned.
Education was the second independent variable that I treated as ordinal data. The data categorization in this area included lower and higher grades, college graduates, high school graduates, and non-college post-high school. Even though the original data set presented sex categories in this section, I chose to work with these four for convenience and easy handling of data. Therefore, I decided to categorize the whole data set into the four above categories, which simplified my work.
The income level was my last independent variable, which entailed specific sub-categorization of household incomes that ranged from $ 20 000 to $ 200, 000. since this variable had specific sub-categorization, it was identified as nominal data. The categorization from the source of data was grouped into two, namely household incomes 2 and 3. Due to the need to choose to work with one category, I had to consider a group likely to yield more accurate data during analysis. Therefore, I decided to work with household three since it involved large numbers convenient to work with. The household three sets of data involved applying dichotomous categorization into $75 000 and $ 75 000 and above. This kind of dichotomous categorization would allow for an easy approach of layered analysis to determine the effects of the independent variables on the dependent variables.
My main concern with the data was to analyze the three independent variables and how they affected the topic. For that reason, I chose not to alter the two dependent variables in the study. Individuals’ perceptions of creative art and level of creativity vary based on many factors that I could not manage to handle in this single analysis. Therefore, I saw it right to concentrate on the independent variables to maintain the accuracy of the results.
Analysis
Analysis of any numerical data requires relevant applications such as SPSS or Microsoft excel for less detailed studies. For my research, SPSS would suffice due to the high levels of analyses and accuracy needed. During my analysis, I will consider both descriptive and inferential analyses. Under descriptive analysis, I will run my data into the software to determine measures such as mean, median, percentiles, and frequency distributions. Based on the results, I will decide on the most appropriate descriptive analysis to present. Besides, I will perform chi-square analysis as my inferential statistics on the data set. After that, I will rely on the underlying theoretical basis to decide on the significance of the results. Based on the theoretical analysis, an alpha value of 0.05 is used as a point of reference to determine the relationship and importance of the analyzed variables. For p-values less than 0.05, the interpreted data is statistically significant to all the tested variables. Additionally, any p-value greater than 0.05 indicates insignificances between the chosen variables imply the need to drop the research hypothesis and use the null hypothesis. I will apply this framework to determine the relationship between my variables and find the most appropriate hypotheses between the research and the null hypotheses I identified earlier.
The first process of my analysis will involve determining central tendencies for the data by running it in the SPSS software to generate frequency distribution tables. The frequency distribution tables will be descriptive tests, which I will use to determine the mean, median, standard deviation, and related measures for descriptive statistics. On inferential statistics, I will generate a bivariate table followed by a chi-square analysis to determine the relationship between the variables identified. I will repeat the process for all three independent variables to assess their effects on the dependent variables and their relationship using the p-value.
Results
From the results, I will be able to make relevant inferences from the variables analyzed to determine the relevance of research questions and hypotheses. The results are presented in tables and distribution figures generated from SPSS. The results are generated based on the analysis of the effects of independent variables on the dependent variables shown. The results are analyzed through chi-square to determine the relationships between independent variables and dependent variables. Achieving an accurate analysis has involved a generation of a bivariate table to be used alongside chi-square to predict the significance of the results by comparing it to the p-value.
Ethnicity was my first independent variable considered nominal data since it is a noun with general categorization. Under the variable, I analyzed different ethnicities used in the study, and they included Native Indian American, Asian, Black, Latino, Native Hawaiian, White, Multiracial, other, and I don’t know. For convenience and ease, I removed the category “other” while handling the data by marking it as missing to allow for easy analysis of multiracial data. Ethnicity and IV entailed all these racial subcategories, implying that the researchers used a large sample size during their investigation. Also, they selected the most affected ethnicities in the regions as far as the topic is concerned. Based on the results from my analysis of the variable, I ranked the races based on the highest respondents to the lowest. The order was whites, Latino, Blacks, Asians, multiracial, native Indian American, other, and native Hawaiian.
Results on the first independent variable indicate ethnicity/race involves different responses across the identified races. The outcomes for the analysis of responses by each race are presented in the table in the appendix section. From the table, it is evident that whites were the majority when responding on frequencies of creative encounters and technological use. 69.6% of white participants reported their love for creativity and a positive perception of human creativity. The group showed a frequency of 3231, which is a high frequency indicating their positive response to the variable. This suggests that many white participants who participated in the study believe in the importance of human creativity and also love creativity. Creativity herein included education-based and art-based creativities. The second race was the Latino, which recorded 10.9% of individuals having a positive perception of human creativity and the passion or love for the same. Even though there is a huge gap between the percentage of whites and Latinos, the results show that 10.9% of Latinos in the location of the study area have a positive perception as far as education-based creativity is concerned.
The Latino had a frequency of 507, indicating a positive response of the population to the creative-based activities. The third position from the analysis was the Blacks, with a 7.2% response in support of the hypothesis. According to the respondents, 7.2% of the total participants who responded that they love creativity and have a positive feeling about it were Blacks. The frequency for Blacks as far as the attendance of creativity-based activities are concerned alongside their responses on the same was 387. Asians showed a frequency of 333 and a percentage of 7.2 to become the fourth race on the list. The figure indicates that 333 Asians responded positively to the good side of creativity among human beings in the sample used. Multiracial participants generated 2.1% with a frequency of 98. An implication of this is that individuals’ participants in the study who had mixed races showed up for the responses for a total of 98 participations. Among all the respondents across the sample, only 49 native Indian Americans showed up for the replies, adding up to 1.1% of the total participants. Other races constituted 0.6% of the total respondents, with an absolute number of 30. Lastly, only ten native Hawaiian, comprising 0.2%, participated as respondents in the study.
On the second independent variable, income level, household three used generated results with two frequencies. The two frequencies entailed data of individuals with income below $ 75 000 and individuals with income above $ 75 000. 60.5% of individuals withhold income below $ 75 000, equivalent to 461 participants, and 39.5% of individuals with household income above $ 75 000, equal to 301 participants, were recorded. The data were analyzed by generating a frequency distribution table in figure 2 in the appendix section.
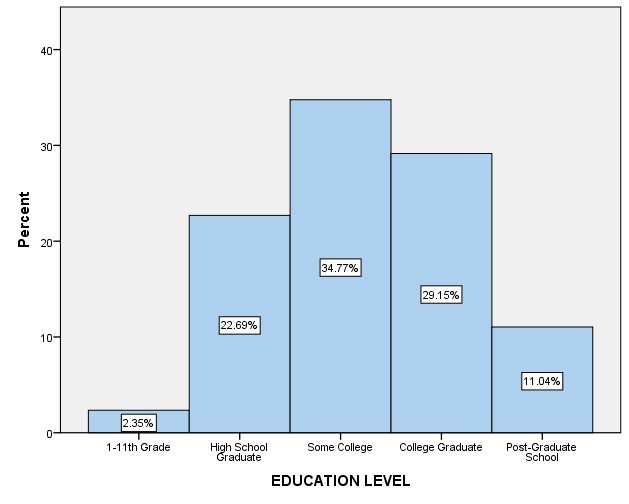
Education’s third independent variable showed different results based on academic levels. Some college level was the leading with a frequency distribution of 1615 constitution, a percentage of 34.8%. Next were college graduates with a frequency distribution of 1354, constitution 29.1%. Next were high school graduates with a frequency distribution of 1054, representing 22.7%. Next was post-graduate high school, with a frequency distribution of 513, representing 11.0%. Lastly, 1-11th grade showed a frequency distribution of 109, representing 2.3% of the total participants.
The bivariate table assisted me in determining the significance of the results by comparing the results to those of the chi-square test. Based on the theoretical framework of p-value, I made relevant conclusions based on level of education as an IV and perception of individuals on creativity as DV. The analysis of Chi-square generated a p-value of 0.000. based on the theoretical framework, any p-value below 0.05 indicates that the relationship between the variables in question is significant. I also conducted a chi-square test for the relationship between race and perception of creativity among individuals. I got a p-value of 0.00, indicating the strong significance of the two variables. Therefore, the relationship between the level of education and the perception of individuals on creativity is significant, hence, the validity of the research hypothesis.
Discussion
From the results, it is evident that all the independent variables identified affected the dependent variables. Ethnicity is a major factor affecting the level of creativity among individuals. Some ethnic groups are more exposed to technological advancements and positive environments for creativity than others. Ethnic groups with high exposure to technology and a positive perception of the invention are likely to embrace high levels of creativeness compared to others (Assari, 2018). For example, whites are likely to embrace creativity due to the positive environment and perception of creative-based activities they have been brought up. Other ethnicities, such as Blacks and Latino, may have different unconducive settings from varied cultural backgrounds that may hinder their perception of creativity. Multiethnic individuals showed a relatively slower response due to the mixed cultural beliefs hindering their perception of the invention. Race as a social factor is a major determinant of human perception of creativity (Acar et al., 2019). The main reason for this is the cultural perspective of each race across the globe. Like the differences in religion and science, some ethnic groups do not believe in creative innovation since every superior thought is left to beliefs. Therefore, individuals from such ethnicities may find a hard time participating in creative-based practices.
The income level is another factor that greatly influences individuals’ perception and passion for creativity. From the results, individuals with high household income levels are less likely to participate in creative activities than those with low household incomes. The results are based on the fact that individuals from low-income households may have better reasons for involving in creative activities, especially art-based creativity, to boost their income. Art-based creativity, such as music, drawing, and dancing, is used by many youths worldwide as a source of income (Brimhall & Mor Barak, 2018). However, the difference in attendance of creative-based activities between high and low-income individuals may be minimal. The number of individuals from low-income households who are most likely to attend creative-based functions is slightly higher than those from high-income families. The main reason for this observation is that those from high-income households normally participate in such processes is spectators, while those from low-income households attend as participants with the main aim of boosting their income. Participants are more likely to take the events at heart compared to spectators.
Lastly, education also plays a major role in determining individuals’’ perceptions and activities in creative-based events. A high level of education is associated with a positive perception of creative arts and educational-based creativity. The individuals responsible for technological inventions and innovations have probably attained higher educational levels. Creativity also entails an intensive thinking process, implying an active involvement of the brain’s schema. Therefore, the highly educated are more likely to develop creative ideas than the less educated.
References
Acar, O. A., Tarakci, M., & Van Knippenberg, D. (2019). Creativity and innovation under constraints: A cross-disciplinary integrative review. Journal of Management, 45(1), 96-121.
Adams, R. L. (2017). Powerful examples of artificial intelligence are in use today. Forbes. http://www.Forbes.com/sites/robertadams/2017/01/10/10-powerful-examples-of artificial-intelligence-in-use today
Assari, S. (2018). Parental education attainment and educational upward mobility; role of race and gender. Behavioral Sciences, 8(11), 107.
Bakas, F. E., Duxbury, N., Remoaldo, P. C., & Matos, O. (2019). The social utility of small-scale art festivals with creative tourism in Portugal. International Journal of Event and Festival Management.
Brimhall, K. C., & Mor Barak, M. E. (2018). The critical role of workplace inclusion in fostering innovation, job satisfaction, and quality of care in a diverse human service organization. Human Service Organizations: Management, Leadership & Governance, 42(5), 474-492.
Christian, C. S., & Scott, C. N. (2022). Characteristics and Use Patterns of Outdoor Recreationists on Public Lands in Alabama—Case Study of Bankhead National Forest and Sipsey Wilderness Area. Resources, 11(3), 26.
Kassymova, G. К., Tokar, O. V., Tashcheva, A. I., Slepukhina, G. V., Gridneva, S. V., Bazhenova, N. G., & Arpentieva, M. R. (2019). Impact of stress on creative human resources and psychological counseling in crises. International journal of education and information technologies, 13(1), 26-32.
Appendices
Table 1
| Race | Frequency | Percent |
| Native Indian American | 49 | 1.1% |
| Asian | 333 | 7.2% |
| Black | 387 | 8.3% |
| Latino | 507 | 10.9% |
| Native Hawaiian | 10 | 0.2% |
| White | 3231 | 69.6% |
| Multi-Racial | 98 | 2.1% |
| Other | 30 | 0.6% |
| Total | 4645 | 100% |
Fig. 1
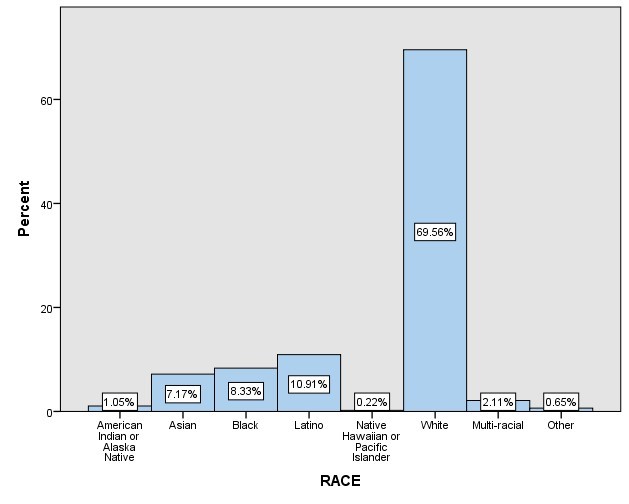
Table 2: Level of Income
| Income | Frequency | Percent |
| Below $75,000 | 461 | 60.5% |
| Above $75,000 | 301 | 39.5% |
| Total | 762 | 100% |
Fig. 2
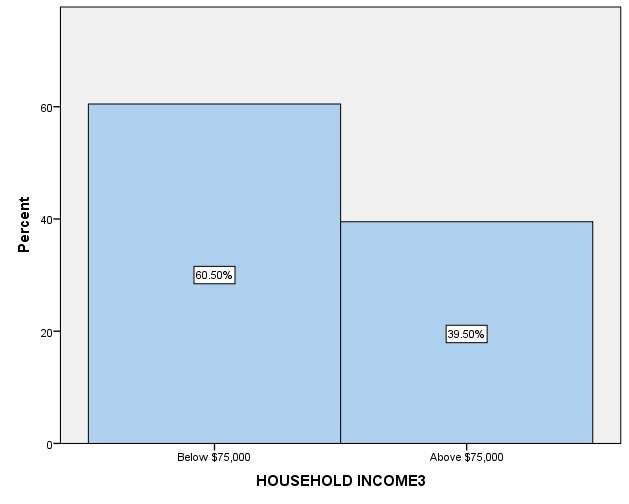
Table 3: Level of Education
| Education | Frequency | Percent |
| 1-11th Grade | 109 | 2.3% |
| High School Graduate | 1054 | 22.7% |
| Some College | 1615 | 34.8% |
| College Graduate | 1354 | 29.1% |
| Post-Graduate School | 513 | 11.0% |
 write
write