Research Question
Do different sugars affect yeast’s respiration rate compared to two monosaccharides and two disaccharides during aerobic respiration?
Introduction and Rationale
One of the central aspects of aerobic respiration is that it takes place in the presence of oxygen and is used in various life aspects, such as fermentation. I first learned about fermentation when I helped my mother with baking naan bread, a very common flatbread in India. I was amazed and fascinated by how the naan rose due to the presence of yeast and sugar. This raised my curiosity, and I decided to learn more about fermentation and respiration, where I discovered that various sugars have different respiration rates in yeast. Therefore, I decided to focus my internal assessments on how different sugars affect respiration rates compared to two monosaccharides and two disaccharides.
Background information
Respiration is the process through which energy is released through the oxidation of carbohydrates. The process occurs in the mitochondria of plants, animals, and humans.[1]Aerobic respiration is a method through which plants and animals respire in the presence of oxygen, as shown by the equation below;
C6H12O6(aq) + 6O2(g) → 6CO2(g) + 6H2O(l) + ATP(energy).
During respiration, glucose reacts with six molecules of oxygen to produce energy in the form of ATP, 6 moles of water, and 6 moles of CO2. Various factors affect aerobic respiration, such as the supply of oxygen and the type of sugar present. Sugars are carbohydrates that can be chemically classified as monosaccharides and disaccharides.
A monosaccharide is a group of simple sugars belonging to the most basic monomers. They are colorless, and they are highly soluble in water. Examples of monosaccharides include; fructose (the sugar present in fruits), glucose (present in carbohydrate foods such as wheat and potatoes), and galactose (sugars present in milk and other dairy products).
Disaccharides are a group of sugars made up of more than one molecule of simple sugars (monosaccharides). They are crystalline and highly soluble in water. Some examples of disaccharides include; sucrose (1 glucose and one fructose molecule), lactose (1 galactose and glucose molecule), and maltose (2 glucose molecules).[2]
During aerobic respiration, monosaccharides have the highest rate of aerobic respiration since no energy is required to break them down. On the other hand, disaccharides are less effective in respiration since energy is required to break down the two molecules into monosaccharides and disaccharides.
Aim
The primary goal of this exploration is to investigate the effect of different sugars on yeast respiration rate. Yeast is used since it breaks down sugars into energy, CO2, and water. The carbon dioxide, CO2, will be released into the atmosphere. The carbon dioxide and CO2 production rates are equivalent to the rate of respiration. The following sugars will be used in this exploration; (lactose, glucose, fructose, maltose, and sucrose). A Vernier CO2 gas sensor will be used to measure the volume of gas produced within a stipulated period.
Hypothesis
In this exploration, it is hypothesized that glucose solution will have the highest rate of aerobic respiration. This is because glucose can trigger unexpected and hormone-like effects, including the activation of cellular growth.[3]Consequently, it is also hypothesized that the rate of aerobic respiration in the control trial will be (0) since there is no sugar for the yeast to act upon.
Variables
The variables for this investigation are defined as follows:
Independent variable
Sugar solutions will be used as an independent variable in this exploration with two monosaccharides and two disaccharides. There will be a controlled trial where no sugar will be added to the yeast.
Dependent variable
The rate of carbon dioxide and CO2 production in yeast will be used as the dependent variable in this experiment. A Vernier CO2 gas sensor will be used to measure the volume of gas produced at a given period. Time was set for ten minutes since increased times led to increased gas production; thus, it was essential to control the time factor. To calculate the rate of gas production, the following formula will be deployed;
Control variable
The primary control variable in this experiment will be trials with (0) sugar concentration. However, the table below shows other variables that will be used as a control in this experiment, how they will be controlled, and their impact on the final data.
Table 1: Control variable table
| Variable | Impact on the results | How will they be controlled |
| Mass of sugar | -Different masses of sugar will have different respiration rates, thus impacting the final data. Sugar will also provide fuel to the yeast. | -The exact mass of sugar, 10 ±0. 10𝑔 will be used in the entire experiment. |
| Mass of yeast | -the varying mass of yeast will impact the volume of CO2 gas produced, thus impacting the final results. | -To ensure data accuracy, the same mass (5±0. 10𝑔) of yeast will be used in the entire exploration. |
| Type of yeast | Various types of yeast have different rates of respiration. Using different yeast will have an impact on the final data. | -Sae type of yeast (S. cerevisiae) will be used in the entire experiment. |
| Time for Respiration | The respiration rate tends to reduce with time as all the substrates have been used. Varying times for respiration will result in inaccurate results. | -The tie of each trial will be
(10 minutes). A digital timer will be used during the entire experiment to ensure an accurate time. |
| The temperature of the water bath | Temperature does affect the rate of a chemical and biological reaction. Different temperatures will affect the final data. | -The experiment will be carried out in the lab, where temporaries will be controlled to 35±0. 50C (optimal temperature for the fermentation of yeast) |
| Weighing balance | -Different electronic balances have different uncertainties. Using different weight balances will harm the final results. | -The same electronic balance
±0experiment.. 10𝑔 will be used in the entire |
Materials used
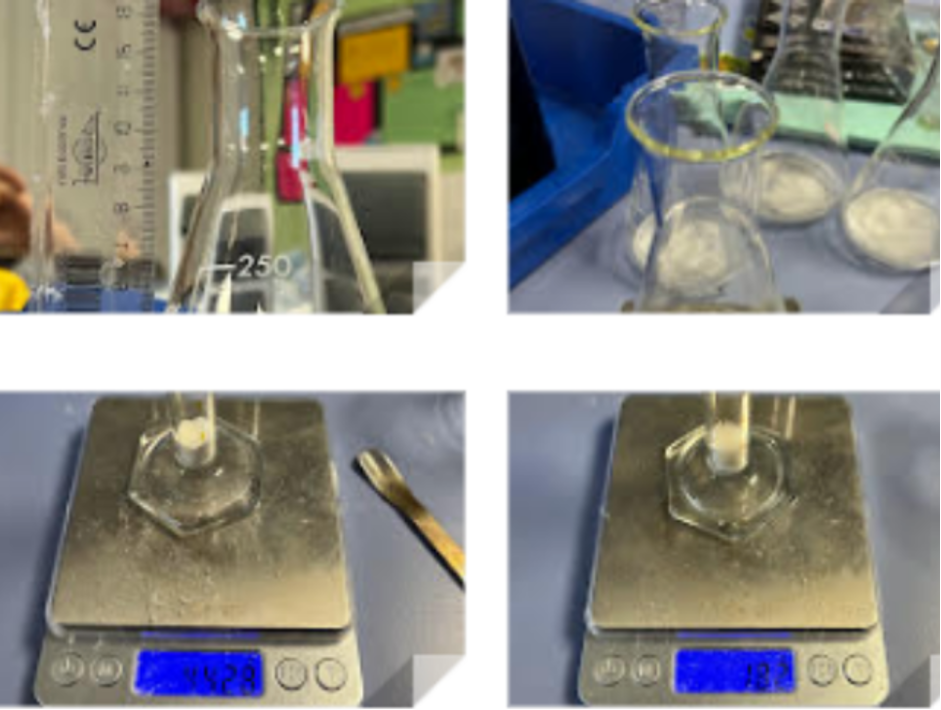
- -Dried (S. cerevisiae) yeast (200 ±0. 10g)
- -Distilled water (100ml)
- -Sugars (sucrose, maltose, glucose and fructose) 50 ±0. 10g
- -Digital weighing balance
- -4-Beakers (250 ml)
- -1-graduated cylinder (250 ml)
- -4- Stirring rid
- -1- Water bath
- -5- Test tube
- -Digital timer
- -1- Vernier CO 2 gas sensor (+/- 10% ppm (source: Vernier)
Method
- Set the hot plate at 35±0. 50C and prepare a water bath
- Using a graduated cylinder, measure 50ml of water and add it to the glass beaker. Measure 3 ±0. 01g of dried yeast using a measuring scale and stir the solution.
- Using a digital measuring scale, measure 10±0. 01𝑔 of glucose in a separate beaker and add 100ml of water.
- Stir the solution using a glass stirring rod until all the sugar has dissolved.
- Measure 5 ml of yeast solution prepared in step (2) above; place the solution on a hot plate 35±0. 50C for 5 minutes to activate the yeast.
- Pour the yeast solution and (100ml) glucose (sugar) solution into the carbon dioxide probe bottle and cap the bottles.
- Start the timer and record the mass of CO2 produced in 1-minute intervals for 10 minutes.
- Repeat steps 3-7 using other sugars (sucrose, maltose, and fructose).
- Repeat step (8) four more times to ensure data accuracy and consistency
Safety Issues
Risk assessment
All the glassware and solution should be handled with great care to avoid accidents and injuries during the experiment. Lab coats and other protective equipment, such as goggles, should be worn at all times. Yeast can cause an allergic reaction in some individuals; thus, plastic gloves should be worn at all times during the experiment.[4]
The sugar used in this lab is for experimental purposes only; thus, it cannot be consumed.
Environmental issues
Disposing of yeast is harmful to the environment and other small animals; therefore, yeast solutions should be boiled to destroy all the yeast available.
Ethical considerations
It is unethical to use sugars and later dupe them away; however, the sugar used in this experiment is for learning purposes only. A minimum sugar solution will be deployed to ensure less wastage.
Raw data collection
3% of sugar was used because dietary guidelines suggest that the added sugar should be less than 10%.
Table 2: Raw data: Sucrose and CO2 production
| Time | The volume of CO2 (ppm±3%) sucrose | ||
| Trial 1 | Trial 2 | Trial 3 | |
| 0 | 0.00 | 0.00 | 0.00 |
| 1 | 50.00 | 3.00 | 112.00 |
| 2 | 71.00 | 4.00 | 172.00 |
| 3 | 100.00 | 10.00 | 216.00 |
| 4 | 109.00 | 23.00 | 244.00 |
| 5 | 112.00 | 29.00 | 272.00 |
| 6 | 131.00 | 49.00 | 287.00 |
| 7 | 137.00 | 51.00 | 297.00 |
| 8 | 140.00 | 57.00 | 315.00 |
| 9 | 146.00 | 62.00 | 328.00 |
| 10 | 156.00 | 64.00 | 331.00 |
Table 3: Raw data: (maltose)
Maltose was used to show if there is a difference between one unit and two units of glucose in the production of carbon dioxide.
| Time | The volume of CO2 (ppm± 3% ) maltose | ||
| Trial 1 | Trial 2 | Trial 3 | |
| 0 | 0.00 | 0.00 | 0.00 |
| 1 | 16.00 | 109.00 | 162.00 |
| 2 | 44.00 | 178.00 | 212.00 |
| 3 | 60.00 | 203.00 | 266.00 |
| 4 | 110.00 | 206.00 | 331.00 |
| 5 | 119.00 | 222.00 | 365.00 |
| 6 | 132.00 | 272.00 | 415.00 |
| 7 | 144.00 | 306.00 | 440.00 |
| 8 | 144.00 | 337.00 | 478.00 |
| 9 | 166.00 | 362.00 | 484.00 |
| 10 | 169.00 | 384.00 | 512.00 |
Other tables containing raw data have also been recorded (see Appendix tables)
Sample calculations
Average volume
To calculate the average volume of gas produced, the following formula was used;
The average volume of CO2 = (Trial1 + Trial2 + Trial3) ÷ 3
For instance maltose, the average carbon dioxide was produced as follows, and the same method was used to calculate the average volume of the other sugars;
The average volume of CO2 = (16 + 1093 + 63) ÷ 3 = 95.601
Rate of gas production
The rate of gas production can be computed as follows;
Rate of gas production = Average CO2 produced ÷ Time
For instance, Rate of CO2production (maltose) = 222.67 ÷ 10 = 22.27 ppm/min
The same method was used to calculate the rate of CO2 produced for other sugars, as shown in the processed table below
Processed data table 1
| Sugar type | The average volume of CO2
(ppm ± 3%) |
Rate of Reaction
(ppm min-1 ± 0.1 ppm min-1) |
| control | 0.00 | 0.00 |
| Maltose | 222.67 | 22.27 |
| Sucrose | 123.58 | 12.39 |
| Glucose | 312.97 | 31.30 |
| Fructose | 91.27 | 9.13 |
| Lactose | 143.80 | 14.30 |
Processed data table 2
| Volume of CO2 (ppm ±3%) | ||||||||
| Time | Maltose | Sucrose | Glucose | Fructose | Lactose | |||
| 0 | 0.00 | 0.00 | 0.00 | 0.00 | 0.00 | |||
| 1 | 95.67 | 55.00 | 173.67 | 39.67 | 60.00 | |||
| 2 | 144.67 | 82.33 | 240.33 | 59.67 | 91.33 | |||
| 3 | 176.33 | 108.67 | 291.00 | 74.33 | 95.00 | |||
| 4 | 215.67 | 125.33 | 320.33 | 83.33 | 100.00 | |||
| 5 | 235.33 | 137.67 | 335.00 | 91.33 | 118.00 | |||
| 6 | 273.00 | 155.67 | 346.33 | 108.00 | 149.33 | |||
| 7 | 296.67 | 161.67 | 379.33 | 118.33 | 171.00 | |||
| 8 | 319.67 | 170.67 | 431.00 | 134.33 | 205.33 | |||
| 9 | 337.33 | 178.67 | 444.33 | 142.00 | 214.00 | |||
| 10 | 276.50 | 110.00 | 481.33 | 167.00 | 234.00 | |||
Analysis
Based on the table above, the average volume produced by maltose is 222.67 ppm, the average volume of CO2 in sugar is 0 ppm, and 312.97 ppm in glucose. The above data can be presented in a graph, as shown in the figure below:
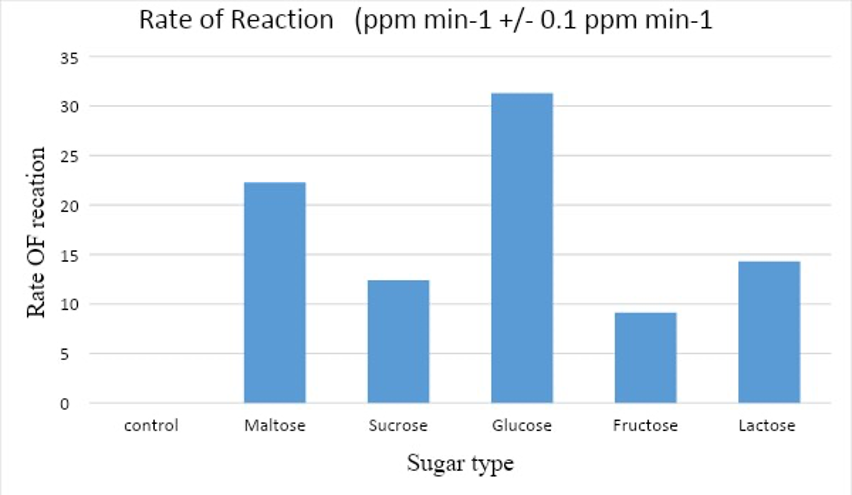
Based on the bar chart above, it is evident that glucose has the fastest average rate (31.3), followed by maltose (22.27), sucrose (12.39), and finally, fructose (9.13). The control variable has (0 ppm/minute) as expected, thus confirming my hypothesis, which stated that “glucose solution will have the highest rate of aerobic respiration. I also hypothesize that the rate of aerobic transpiration in the control trial will (0) since there is no sugar for the yeast to act upon”. Based on processed data in table 2 above, a graph of gas volume every minute has been plotted as shown by the graph below;
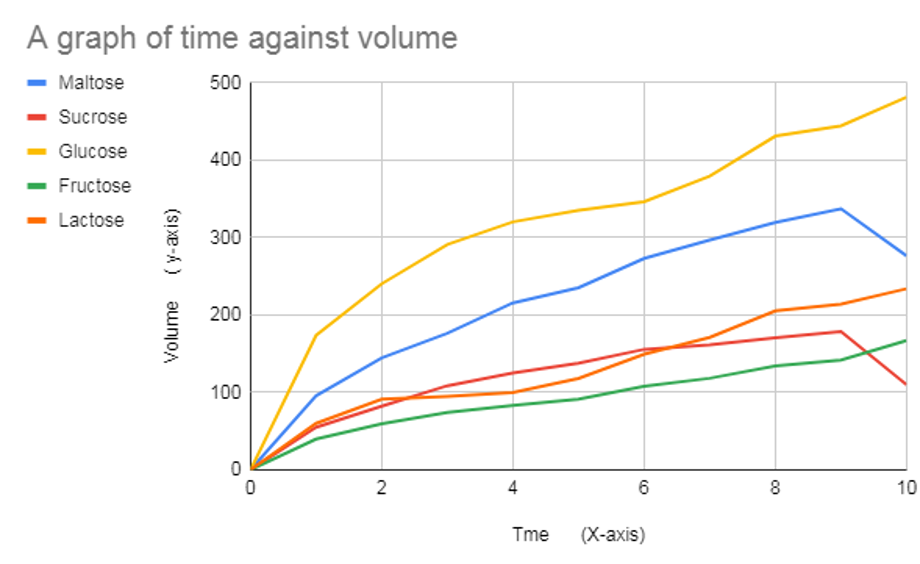
Based on the graph above, there was no gas production in the control experiment. The gas production increased every minute from 0 to 10 minutes, but gas production began to reduce in the 10th minute during glucose use. Glucose had the highest gas production, while fructose had minor gas after sugar (control).[5] The lines are of different curves, which indicates that the sugars react at different rates, which also supports that an increase in time also causes an increase in volume.
Conclusion
This experiment aimed to investigate the effect of different types of sugars on aerobic respiration rate. The sugars used in this experiment are; maltose, sucrose, glucose, and lactose. In the control trial, no sugar was added to the yeast. Before this experiment, it was hypothesized that glucose would have the highest rate of aerobic respiration than other sugars. It was also hypothesized that, as in the control trial, the rate of aerobic respiration is (0). Based on the results obtained above, it is clear that the glucose respiration rate is high (31.3 ppm/min). The respiration rate is the least in fructose (913pp/min). The control trial recorded no sugar respiration since yeast cannot undergo respiration without sugar. Therefore, the hypothesis of the investigation was achieved, which stated that glucose would have the highest rate of aerobic respiration in yeast.
Evaluation Strengths of the experiment
The method used in this exploration was straightforward to follow. The method also made it easy to reset the apparatus and thus to make the method time-saving. All the data was collected at optimal temperature (350C), thus allowing data comparison.
Limitation and adjustment
There were only three trials in each experiment. The few numbers of trials might have impacted the accuracy of data. The number of trials should be increased to 5 to ensure data accuracy and consistency. The time for fermentation was 10 minutes in each trial. The process of fermentation was not exhausted since the equilibrium was not achieved. In the future experiment, the time fermentation should be increased to 1 hour to ensure the entire fermentation process has been exhausted to have accurate data.
Extensions
Enzymes are biological catalysts that speed up the rate of biological and chemical reactions. Temperature also can speed up the rate of chemical reaction, and thus, using different temperatures will change the investigation results. Additionally, using different polysaccharide sugars would also increase the rate of yeast respiration, and thus one needs to investigate this claim. Therefore, it is vital to investigate how temperature and enzymatic reaction affects aerobic respiration. The research question should be; “What are the effects of using more sugars (sucrose, maltose, fructose, and galactose) and temperature on the rate of enzymatic reaction?
Bibliography
Crancer, Madeleine, Juliet Roy, Christopher Zayaleta, and Emily Hjalmarson.” analyzing the rate of carbon dioxide created by fermentation in yeast with different types of sugars.” Journal of Undergraduate Biology Laboratory Investigations 1, no. 2 (2018).
Hoang Nguyen Tran, Phuong, Ja Kyong KO, Gyeongtaek Gong, Youngsoon Um, and Sun-Mi Lee. “Improved simultaneous co-fermentation of glucose and xylose by Saccharomyces cerevisiae for efficient lignocellulosic biorefinery.” Biotechnology for Biofuels 13, no. 1 (2020): 1-14. https://www.health.harvard.edu/blog/are-certain-types-of-sugars-healthier-than-others -2019052916699#:~: text=The%20monosaccharides%20include%20glucose%2C%20fructose.
Rashdan, Nabil A., Alisia M. Sim, Lin Cui, Kanchan Phadwal, Fiona L. Roberts, Roderick Carter, Derya D. Ozdemir et al. “Osteocalcin regulates arterial calcification via altered Wnt signaling and glucose metabolism.” Journal of bone and mineral research 35, no. 2 (2020): 357-367.
Sarti, Lucrezia, Guillaume Lezmi, Francesca Mori, Mattia Giovannini, and Jean-Christoph Caubet. “Diagnosis and management of hypersensitivity reactions to vaccines.” Expert review of clinical immunology 16, no. 9 (2020): 883-896.
ScD, Vasanti Malik. “Are Certain Types of Sugars Healthier than Others?” Harvard Health, May 29, 2019.
Appendices
Appendix 1: glucose and CO2 production
| Time | The volume of CO2 (ppm) glucose | ||
| Trial 1 | Trial 2% | Trial 3 | |
| 0 | 0.00 | 0.00 | 0.00 |
| 1 | 130.00 | 200.00 | 191.00 |
| 2 | 146.00 | 259.00 | 316.00 |
| 3 | 180.00 | 309.00 | 384.00 |
| 4 | 186.00 | 350.00 | 425.00 |
| 5 | 196.00 | 365.00 | 444.00 |
| 6 | 202.00 | 378.00 | 459.00 |
| 7 | 269.00 | 400.00 | 469.00 |
| 8 | 387.00 | 419.00 | 487.00 |
| 9 | 405.00 | 428.00 | 500.00 |
| 10 | 492.00 | 440.00 | 512.00 |
Appendix 2: Fructose and CO2 production
| Time | The volume of CO2 (ppm) fructose | ||
| Trial 1 | Trial 2% | Trial 3 | |
| 0 | 0.00 | 0.00 | 0.00 |
| 1 | 56.00 | 59.00 | 4.00 |
| 2 | 79.00 | 65.00 | 35.00 |
| 3 | 98.00 | 68.00 | 57.00 |
| 4 | 109.00 | 75.00 | 66.00 |
| 5 | 118.00 | 78.00 | 78.00 |
| 6 | 149.00 | 84.00 | 91.00 |
| 7 | 171.00 | 84.00 | 100.00 |
| 8 | 203.00 | 87.00 | 113.00 |
| 9 | 214.00 | 93.00 | 119.00 |
| 10 | 234.00 | 100/00 | 125.00 |
Appendix 3: Lactose and CO2 production
| Time | The volume of CO2 (ppm) lactose | ||
| Trial 1 | Trial 2% | Trial 3 | |
| 0 | 0.00 | 0.00 | 0.00 |
| 1 | 60.00 | 60.00 | 60.00 |
| 2 | 90.00 | 94.00 | 90.00 |
| 3 | 95.00 | 95.00 | 95.00 |
| 4 | 100.00 | 100.00 | 100.00 |
| 5 | 118.00 | 118.00 | 118.00 |
| 6 | 149.00 | 149.00 | 150.00 |
| 7 | 171.00 | 171.00 | 171.00 |
| 8 | 203.00 | 203.00 | 210.00 |
| 9 | 214.00 | 214.00 | 214.00 |
| 10 | 234.00 | 234.00 | 234.00 |
[1] Cancer, Madeleine, Juliet Roy, Christopher Zayaleta, and Emily Hjalmarson. “analyzing the rate of carbon dioxide created by fermentation in yeast with different.
Types of Sugars.” Journal of Undergraduate Biology Laboratory Investigations 1, no. 2 (2018).
[2] ScD, Vasanti Malik. “Are Certain Types of Sugars Healthier than Others?” Harvard Health, May 29, 2019. https://www.health.harvard.edu/blog/are-certain-types-of-sugars-healthier-than-others-2019052916699
#:~: text=the%20monosaccharides%20include%20glucose%2C%20fructose.
[3] Hoang Nguyen Tran et al., 2020. Improved simultaneous co-fermentation of glucose and xylose by Saccharomyces cerevisiae for efficient lignocellulosic biorefinery.” Biotechnology for Biofuels 13, no. 1 (2020): 1-14.
[4] Sarti et al., 2020. “Diagnosis and management of hypersensitivity reactions to vaccines.” Expert review of clinical immunology 16, no. 9 (2020): 883-896.
[5] Rashdan et al., 2020. “Osteocalcin regulates arterial calcification via altered Wnt signaling and glucose metabolism.” Journal of bone and mineral research 35, no. 2 (2020): 357-367.
 write
write