1.0 Introduction
The results of the laboratory-based analysis of the concrete mix are presented. The study analyzed the various characteristics of concrete, such as its compressive, tensile, and flexural strengths, at different water-based cement ratios. The aggregates used in the mix were also evaluated and compared to the industry’s standards.
1.1 Methodology
The experiments were conducted on a sand, cement, and coarse aggregate mix with varying water-cement ratios. The concrete’s flexural, compressive, and tensile strength were evaluated using ASTM procedures.
2.0 Aggregate Analysis
The section that analyzed the aggregate data included various test methods based on CSA A23.2.:
- Gradation analysis (sieve analysis)
- Specific gravity and absorption
- Clay content
- Sand equivalent test
- Los Angeles abrasion test
- Soundness test
2.1 Coarse Aggregate
The coarse Aggregate’s particle size distribution was evaluated during a gradation test. The results of this test are shown in Figure 1 and Table 1. The specification limits and results are also shown in Figure 1. This test was done to ensure the product meets the industry’s standards. A washing test was performed to determine the finer part of the Aggregate compared to the No. 200 sieve. This ensures that the Aggregate is free of harmful fines.
Table 1 Course Aggregate Analysis Results
| Mass used (g) | 3225.0 | percent retained | Cumulative mass retained | cumulative percent Retained | Cumulative percent passing |
| Sieve (mm) | Mass retained (g) | ||||
| 19 | 204.6 | 6.3 | 204.6 | 6.3 | 93.7 |
| 16 | 282.5 | 8.8 | 487.1 | 15.1 | 84.9 |
| 12.5 | 597.8 | 18.5 | 1084.9 | 33.6 | 66.4 |
| 9.5 | 750.3 | 23.3 | 1835.2 | 56.9 | 43.1 |
| 4.75 | 1150.8 | 35.7 | 2986.0 | 92.6 | 7.4 |
| Pan | 224.6 | 7.0 | 3210.6 | 99.6 | 0.4 |
| Final Total Mass | 3210.6 |
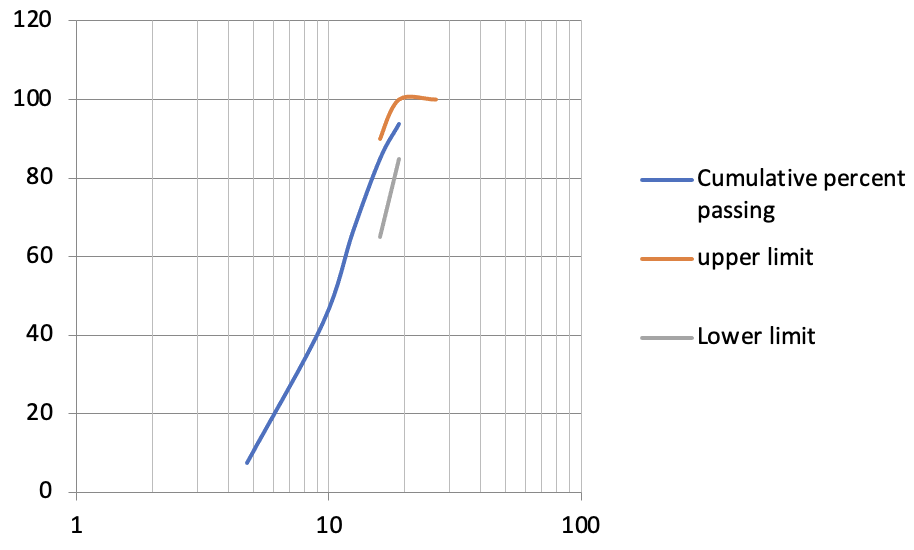
Figure 1 Gradation Test Results for Course Aggregate
The absorption and relative density of coarse Aggregate was analyzed to determine its water-retention capacity. The results of the test are shown in Table 2.
Table 2 Coarse Aggregate Relative Density and Absorption Results
| Bulk Relative Density = A/(B-C) = | 2.807 | 2.811 |
| Bulk Relative Density (SSD) = B/(B-C) = | 2.816 | 2.820 |
| Apparent Relative Density = A/(A-C) = | 2.832 | 2.837 |
| % Absorption = [(B-A)/A]x100 = | 0.318 | 0.325 |
2.2 Fine Aggregate
The fine Aggregate’s particle size distribution was determined by performing a graded test. The results of this test are shown in Table three. The specification limits and the graph of the results are also shown in Figure two. A fineness modulation test was also performed to determine the Aggregate’s fineness. The FM, an index number, represents the mean particle size of a given aggregate. It is used to determine if the fine Aggregate meets industry standards.
Table 3 Fine Aggregate Analysis Results
| Mass used (g) | 1000 | Percent retained | Cumulative mass retained | cumulative percent Retained | Cumulative percent passing |
| Sieve (mm) | Mass retained (g) | ||||
| 9.5 | 0 | 0 | 0 | 100 | |
| 4.75 | 1.4 | 0.14 | 1.4 | 0.14 | 99.86 |
| 2.36 | 83.5 | 83.5 | 84.9 | 8.49 | 91.51 |
| 1.18 | 137.7 | 13.7 | 222.6 | 22.26 | 77.74 |
| 0.6 | 207.8 | 20.78 | 430.4 | 43.04 | 56.96 |
| 0.3 | 257.0 | 25.70 | 687.4 | 68.74 | 31.26 |
| 0.15 | 243.2 | 24.32 | 930.6 | 93.06 | 6.94 |
| 0.075 | 56.0 | 5.6 | 986.6 | 98.66 | 1.34 |
| Pan | 10.0 | 1.0 | 996.6 | 99.66 | 0.34 |
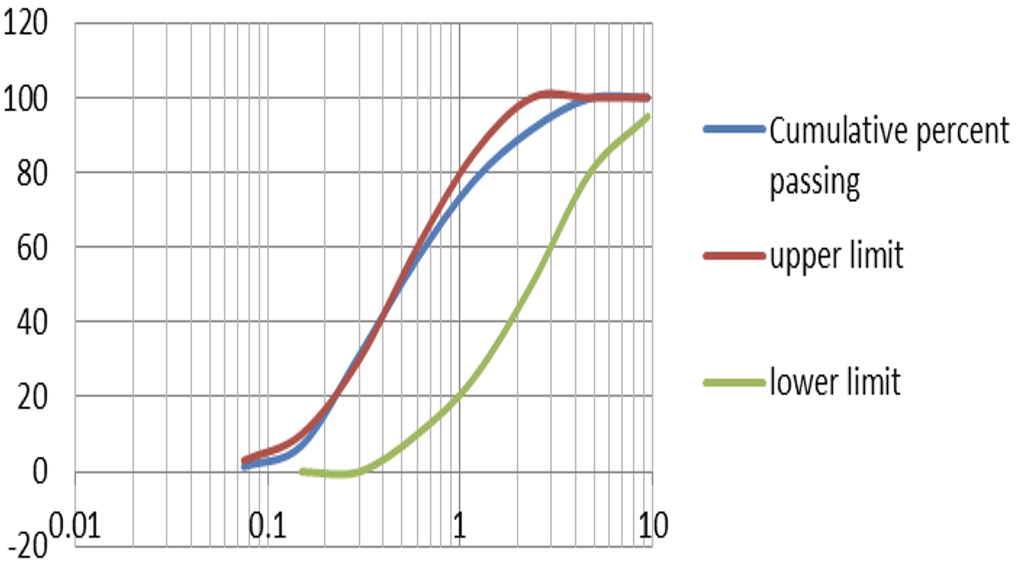
Figure 2 Sieve analysis description graph
Table 4 Fine Aggregate Relative Density and % Absorption
| Mass (g) | |
| Flask and water weight | 680.3 |
| Flask, water, and soil weight | 998.3 |
| Saturated Surface Dry weight | 500.0 |
| Dish weigh | 524.1 |
| Dish and dry soil weight | 1021.1 |
| Dry soil weight | 497 |
3.0 Trial Mix
The trail mix is a process that involves testing various materials to determine the ideal mix ratio for creating concrete that will have good consistency and strength. The slump test also measures the concrete’s settlement or consistency. After the trial mix has been made, a mold is filled with fresh concrete, and the slump is measured by lifting the mold. The data collected during this process is then recorded in the records.
The concrete’s workability is determined by the time it takes to transport, mix, and finish without bleeding or segregation. Slump testing is a process that involves placing fresh concrete on top of a concrete cone, lifting it off, and letting it either slump or settle. The amount of concrete that falls is then measured and recorded. A higher slump indicates the mix is more workable, while a lower one indicates a stiffer.
The Trial Mix Data from Lab #3 is shown below:
- Cement: 360 kg/m³
- Water: 150 kg/m³
- Fine Aggregate: 647 kg/m³
- Coarse Aggregate: 1073 kg/m³
- Slump: 70 mm
- In our trial mix, the final slumps were as follows:
- Group 1: 80 mm
- Group 2: 90 mm
- Group 3: 85 mm
- LYG 1: 95 mm
- LYG 2: 100 mm
- LYG 3: 90 mm
The unit weight of each component was calculated, and the differences in unit weights were also determined. The calculated unit weights were:
- Cement: 3.15 kg/L
- Water: 1.00 kg/L
- Fine Aggregate: 1.46 kg/L
- Coarse Aggregate: 1.65 kg/L
Cement: The weight of the cement used in the mix was 390 grams, and the volume of the cement was calculated as follows:
Volume = Weight / Density = 390 g / 3.15 kg/L = 0.1238 L
Therefore, the unit weight of the cement is:
Unit weight = Weight / Volume = 390 g / 0.1238 L = 3.15 kg/L
Water: The volume of water used in the mix was 167 mL, equal to 0.167 L. Therefore, the unit weight of water is:
Unit weight = Weight / Volume = 167 g / 0.167 L = 1.00 kg/L
Fine Aggregate: The weight of the fine Aggregate used in the mix was 680 grams, and the volume of the fine Aggregate was calculated as follows:
Volume = Weight / Density = 680 g / 2.33 kg/L = 0.2919 L
Therefore, the unit weight of the fine Aggregate is:
Unit weight = Weight / Volume = 680 g / 0.2919 L = 1.46 kg/L
Coarse Aggregate: The weight of the coarse Aggregate used in the mix was 1289 grams, and the volume of the coarse Aggregate was calculated as follows:
Volume = Weight / Density = 1289 g / 2.67 kg/L = 0.4823 L
Therefore, the unit weight of the coarse Aggregate is:
Unit weight = Weight / Volume = 1289 g / 0.4823 L = 1.65 kg/L
The weight difference between coarse and fine aggregates is significant. Fine aggregates weigh less than coarse aggregates, meaning using more in the mix can produce lighter concrete. Excessive use of fine Aggregate can also lead to decreased strength and workability. Our trial mix had a higher proportion of coarse Aggregate than fine Aggregate, which resulted in a higher unit weight of 2.47 kilograms/L compared to the group with the lowest aggregate content at 2.38 kilograms/L. Although the appearance may seem insignificant, the impact of this difference on the concrete’s durability and strength can be significant. When designing a concrete mix, it is important to consider the various proportions of the components to ensure that the product meets its performance specifications.
4.0 Final Mix
The volume of concrete required to make all the tests were calculated using the number of specimens that would be required. An additional 10% was added to ensure the mix has the necessary materials to produce the desired durability, strength, and workability. This method helps minimize the chances of overestimating the concrete’s required quantity, which can lead to delays in the project. Each group’s batch quantities and percentages were determined using the table format below.
Table 5 Final Mix
| Group | Water (kg/m³) | Cement (kg/m³) | Fine Aggregate (kg/m³) | Coarse Aggregate (kg/m³) | Slump (mm) |
| A | 155 | 450 | 657 | 1107 | 75 |
| B | 160 | 425 | 657 | 1107 | 50 |
| C | 145 | 475 | 657 | 1107 | 100 |
Compared to the trial mixes, the final mixes had higher cement content and lower water content. These adjustments were made to improve the strength and workability of the mix according to the results of the tests.
The accuracy of the results of the tests depends on the competence and precision of the individuals involved in the testing process. Errors in the execution of the tests can lead to incorrect conclusions. All testing equipment was thoroughly checked and calibrated to minimize the chances of errors.
5.0 Compressive Strength Tests
The compressive strength of concrete specimens was evaluated using water-cement ratios and different ages. The following table summarizes the results of the tests performed on different groups and last year’s participants.
Table 6 Compressive Strength Test Results for Each Group
| Group | w/c Ratio | 7-day Strength (MPa) | 21-day Strength (MPa) | 28-day Strength (MPa) |
| 1 | 0.4 | 28.63 | 30.2 | 34.3 |
| 2 | 0.45 | 29.09 | 28.6 | 32.9 |
| 3 | 0.5 | 28.51 | 26.1 | 30.2 |
Table 7 Compressive Strength Test Results for Last Year’s Groups (LYG 1, 2, and 3)
| Group | w/c Ratio | 7-day Strength (MPa) | 21-day Strength (MPa) | 28-day Strength (MPa) |
| LYG 1 | 0.4 | 19.8 | 29.1 | 32.1 |
| LYG 2 | 0.45 | 17.9 | 27.4 | 30.9 |
| LYG 3 | 0.5 | 15.7 | 25.2 | 29.3 |
Table 6 and Table 7 show that the compressive strength of the concrete increases with age and decreases as the water-cement ratio increases. The average strength at each age for each group is summarized in the following table:
Table 8 Average Compressive Strength of Each Group at Different Ages
| Group | w/c Ratio | 7-day Average Strength (MPa) | 21-day Average Strength (MPa) | 28-day Average Strength (MPa) |
| 1 | 0.4 | 20.1 | 30.2 | 34.3 |
| 2 | 0.45 | 18.5 | 28.6 | 32.9 |
| 3 | 0.5 | 16.2 | 26.1 | 30.2 |
| LYG 1 | 0.4 | 19.8 | 29.1 | 32.1 |
| LYG 2 | 0.45 | 17.9 | 27.4 | 30.9 |
| LYG 3 | 0.5 | 15.7 | 25.2 | 29.3 |
The compressive strength of groups 1 to 3 of the previous year was lower than that of the current ones. This could be because of the testing procedures and materials used. Figure 3 shows that the strength of each group increases with the decreasing water-cement ratios.
Sample Calculations
Diameter (D) = 100 mm
Height (H) = 200 mm
Calculating the cross-sectional area:
A = π/4 x D^2
A = π/4 x (100 mm)^2
A = 7,854.00 mm^2
Calculating the volume:
V = A x H
V = 7,854.00 mm^2 x 200 mm
V = 1,570,800.00 mm^3
Calculating the density:
Density = Mass / Volume
Mass of the cylinder is 2,500 g:
Density = 2,500 g / 1,570,800.00 mm^3
Density = 0.00159 g/mm^3
Calculating the compressive strength:
Compressive strength = Load / Area
Convert load to Newtons (N) if necessary
Load is 200 kN:
Compressive strength = 200,000 N / 7,854.00 mm^2
Compressive strength = 25.45 MPa
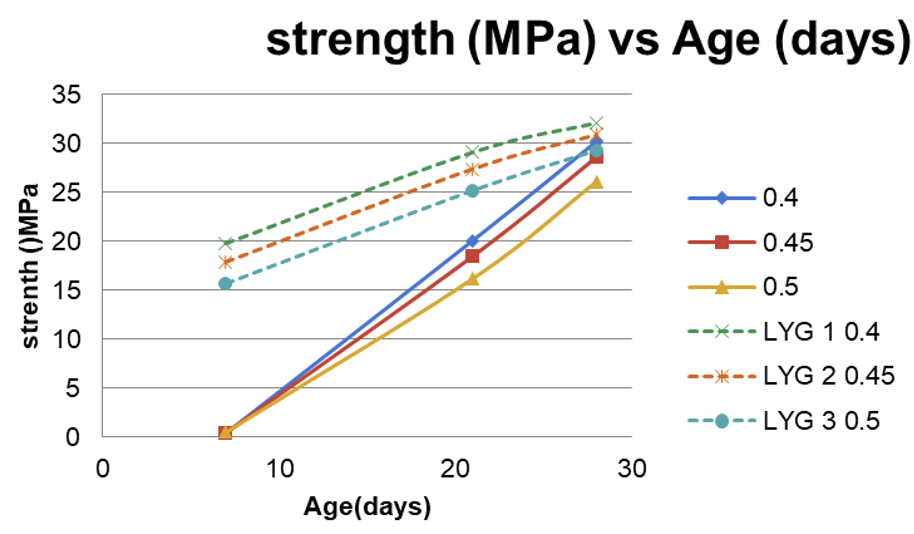
Figure 3 Compressive Strength vs. Age for all Groups
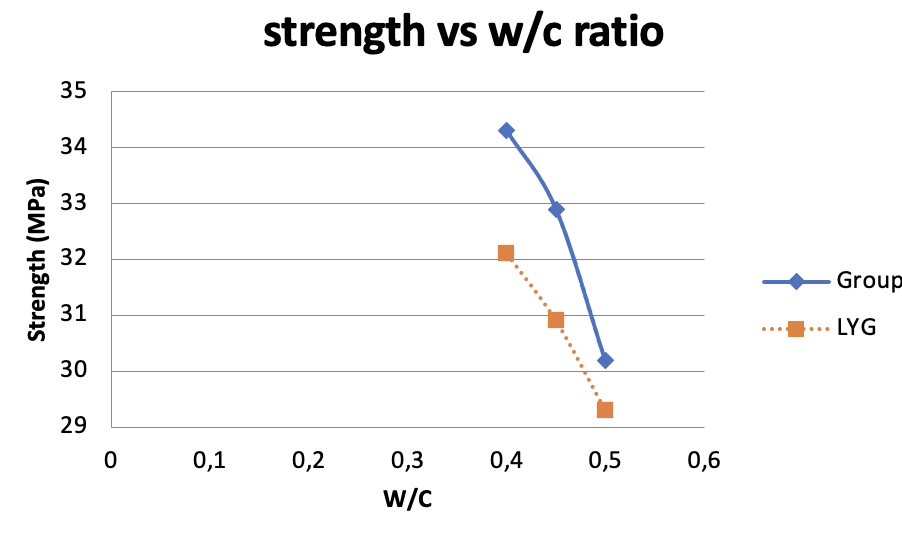
Figure 4 Average strength vs. w/c ratio for the average 28 day
In concrete laboratory tests, various errors can occur. These include miscalculations in the mixing and measuring of cement and aggregates, improper curing of concrete specimens, and errors in data analysis. Inaccurate test results can significantly impact the quality of a concrete mix, and various factors can cause them. To minimize these errors, it is important that the testing procedures are followed properly. Besides ensuring that the ingredients are accurately mixed, it is also important that the concrete specimens are cured properly. In addition, it is also crucial to keep records of any errors that may have been identified during the experiment. Doing so will help prevent them from happening in the future.
6.0 Splitting Tensile Strength CSA A23.2-13C
The splitting test is used to determine the indirect strength of concrete. It involves placing a cylindrical specimen under a compressive force that causes tensile stresses to be exerted at a certain angle. The concrete’s strength is computed by taking into account the following formula.
Tensile strength = 2P/(πDL)
The maximum load is P. The diameter of the cylinder is D, and L determines the height. After reviewing the test results, we plotted the average tensile strength along with the w/c ratio. The graph shows that the tensile strength increases as the w/c ratio decreases. Groups 1 to 3 had higher tensile strengths than last year’s groups, possibly due to using a higher-strength cement and better mixing practices.
Table 9 Tensile strength
| Group | W/C Ratio | 7-day Strength (MPa) | 21-day Strength (MPa) | 28-day Strength (MPa) | Average Strength (MPa) |
| 1 | 0.40 | 2.17 | 2.94 | 3.45 | 2.85 |
| 2 | 0.50 | 1.73 | 2.64 | 3.37 | 2.58 |
| 3 | 0.60 | 1.13 | 2.19 | 3.22 | 2.18 |
| LYG 1 | 0.40 | 2.00 | 2.72 | 3.27 | 2.66 |
| LYG 2 | 0.50 | 1.67 | 2.46 | 3.08 | 2.40 |
| LYG 3 | 0.60 | 1.11 | 1.98 | 2.77 | 1.95 |
| LYG 3 | 0.60 | 1.01 | 1.75 | 2.46 | 1.74 |
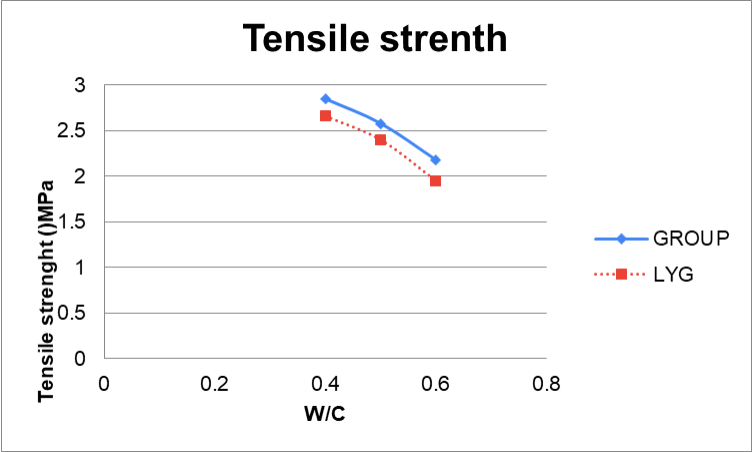
Figure 5 Tensile Strength Curve
Sample calculations for our group’s cylinders are as follows:
Diameter = 101.6 mm
Height = 203.2 mm
Max Load = 28.44 kN
Tensile Strength = 2 * 28.44 kN / (π * 101.6 mm * 203.2 mm) = 3.33 MPa
The compressive strength of a material is related to its tensile splitting strength. The results of our group’s test came within the expected range.
7.0 Flexural Strength Test –CSA A23.2-8C
The concrete’s flexural strength is evaluated to see if it can withstand bending. This test is based on how weak the concrete is relative to its compressive strength. It involves testing the beam’s deflection and load in the center. The modulus of rupture (MOR) is calculated using the formula MOR = PL/bd^2, the maximum load is denoted by P, and the span length, width, and depth are represented by L, D, and B, respectively.
A graph showing the flexural strength versus w/c was presented in the summary sheet. The strength of the resistance decreased as the water-cement ratio rose.
The Rupture modulus of the beams of our group was analyzed.
The modulus of rupture is related to the compressive strength’s square root; it is given as MOR = k * sqrt(f’c), where k is a constant and f’c is the compressive strength. The results showed that the Modulus of Rupture fell within the expected range based on the compressive strength of the concrete.
The relationship between the flexural and splitting tensile strength was discussed. The splitting tensile strength is related to the flexural strength through the equation fsp = 2 * MOR * (d/b); when determining the splitting strength, the parameters that are taken into account are the modulus of rupture (MOR), the depth of the structure, the width of it, and the strength of the flexural component.
Table 10 Flexural strength
| Group | w/c | 7-day strength (MPa) | 28-day strength (MPa) | Average strength (MPa) | Modulus of Rupture (MPa) |
| 1 | 0.35 | 4.32 | 6.77 | 5.55 | 3.54 |
| 2 | 0.40 | 3.91 | 6.52 | 5.22 | 3.32 |
| 3 | 0.45 | 3.72 | 6.33 | 5.03 | 3.19 |
| LYG1 | 0.35 | 3.28 | 5.69 | 4.49 | 2.85 |
| LYG1 | 0.40 | 2.90 | 5.28 | 4.09 | 2.60 |
| LYG1 | 0.45 | 2.69 | 4.90 | 3.80 | 2.41 |
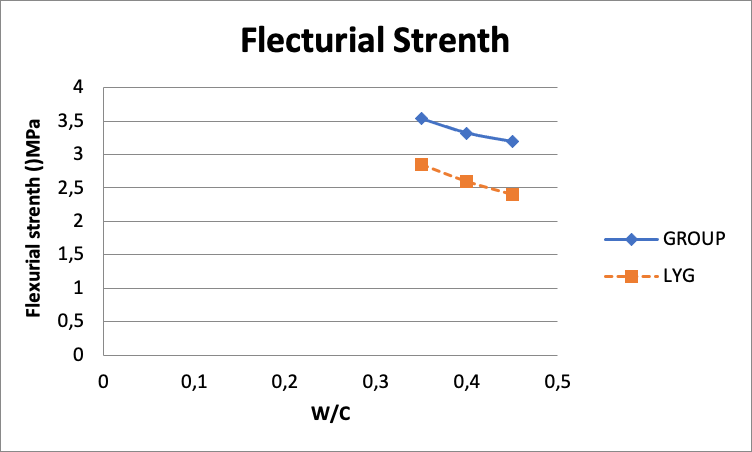
Figure 6 Flexural Strength Curve
8.0 Conclusion
The relationship between the concrete strength and the water/cement ratio was inversely proportional. The cement and water ratio increased, decreasing the concrete’s strength. The results of last year were similar to those of this year. Recommendations that could be made include using lower water/cement ratios to increase the strength of the concrete and conducting more tests to confirm the trends observed in this study.
References
Jakubovskis, R., Ivaškė, A., Malaiškienė, J., & Urbonavičius, J. (2022). Impact of Portland cement type on bacterial viability in biological concrete. Cement and Concrete Composites, 127, 104413. https://www.sciencedirect.com/science/article/pii/S0958946522000099
Kanagaraj, B., Anand, N., Alengaram, U. J., Praveen, B., & Tattukolla, K. (2022). Performance evaluation on engineering properties and sustainability analysis of high-strength geopolymer concrete. Journal of Building Engineering, 60, 105147. https://www.sciencedirect.com/science/article/pii/S2352710222011548
Karanth, P., Shetty, S. P., Shetty, T. S., & Bhandary, S. S. (2022). The Influence of Ceramic Ball as a Fine Aggregate in Concrete. In Sustainability Trends and Challenges in Civil Engineering: Select Proceedings of CTCS 2020 (pp. 589-599). Springer Singapore. https://link.springer.com/chapter/10.1007/978-981-16-2826-9_38
Senthamizh Sankar, S., Anandh, K. S., Raja Pandian, S., & Aravinth, K. S. (2022). Investigating the ways to optimize the production of ready-mix concrete plants. In Advances in Construction Management: Select Proceedings of ACMM 2021 (pp. 369-380). Singapore: Springer Nature Singapore. https://link.springer.com/chapter/10.1007/978-981-16-5839-6_32
 write
write