Musical instruments cover many kinds of products that can be obtained in the domain and range from guitars to keyboards to drums to brass instruments. Music instruments play an essential role in several industries, especially in the production of music, performance, education, and entertainment. Music instruments allow people to express their creativity, explore their musical talents, and get in touch with the multiple cultures of the world. The music instrument market creates a tremendous business activity, including sales, manufacturing, and innovation. Hence, the manufacturers, retailers, and even the consumers must understand the consumers’ choice regarding the musical instrument and their feelings associated with it to make a better decision and enhance consumer satisfaction.
Customer reviews highly influence the decision-making of consumers and businesses in musical instruments. Reviews give consumers insight into the quality, performance, and usefulness of musical instruments in the market and help them make informed decisions before purchase. Reviews are social proof and generally provide buyers with reassurance and credibility. On the other hand, businesses depend on customers to know how the product satisfies them, where the areas of improvement are, and which marketing strategies to lay on.
This project aims to develop a machine-learning model to analyze sentiment in customer reviews of musical instruments based on the Amazon Musical Instruments Reviews dataset. Our goal was to classify the sentiment of the reviews based on text content and corresponding ratings. The tasks would be data pre-processing for missing values and text, followed by feature engineering to extract relevant features from the text, model selection to choose the best classifier, hyper-parameter tuning for optimal model performance, and evaluation using cross-validation.
Methodology
Data collection and description
For the sentiment analysis data, the dataset most fitting is the “Amazon Musical Instruments Reviews” dataset because of its diversity, scale of availability, and real-world relevance. It has 10261 rows and 9 columns. Attributes in the dataset are:
- reviewerID – ID of the reviewer, e.g. A2SUAM1J3GNN3B
- asin – ID of the product, e.g. 0000013714
- reviewerName – name of the reviewer
- helpful – helpfulness rating of the review, e.g. 2/3
- reviewText – text of the review
- overall – rating of the product
- summary – summary of the review
- unixReviewTime – time of the evaluation (unix time)
- reviewTime – time of the review (raw)
Data preprocessing
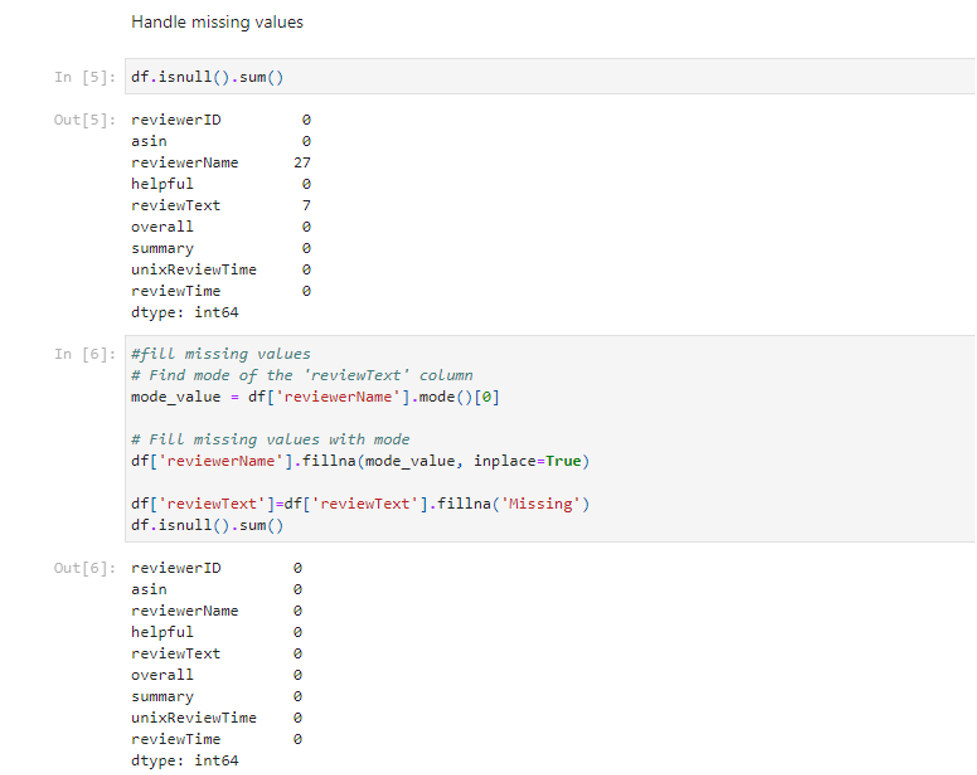
Handling missing values
We followed a two-step approach in the “reviewerName” and “reviewText” fields. First, for the column ‘reviewerName’, we fill in the missing values by replacing them with the mode value, which is the last name I mentioned above. Thus replacing it with a typical and representative value to be used instead of missing names. Further, concerning the ‘reviewText’ column, we replaced the missing values with ’Missing’. The approach is beneficial since it maintains the integrity of the dataset, and the dataset acts as an indicator for the textual missing information (Malviya et al., 2020). This also implements completeness and consistency among the dataset for the following analysis.
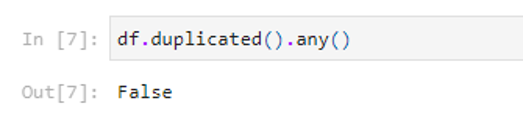
Handling Duplicates
During data preprocessing, we applied a similar check for duplicated dataset entries. Each entry against every other entry in every column is checked and processed to look up duplicates. In the course of the checking, it was noted that, indeed, there were no similar entries in the dataset. This discovery means that individual records in the dataset are independent, and this blocks any instance of redundancy or duplication of data. Preserving data integrity ensures no duplication while preventing any biases or inaccuracies that can be caused later in analyses and modeling processes (Malviya et al., 2020). This is an essential step in that it helps the inferences of the data set and the results of our study to be validated and credible.
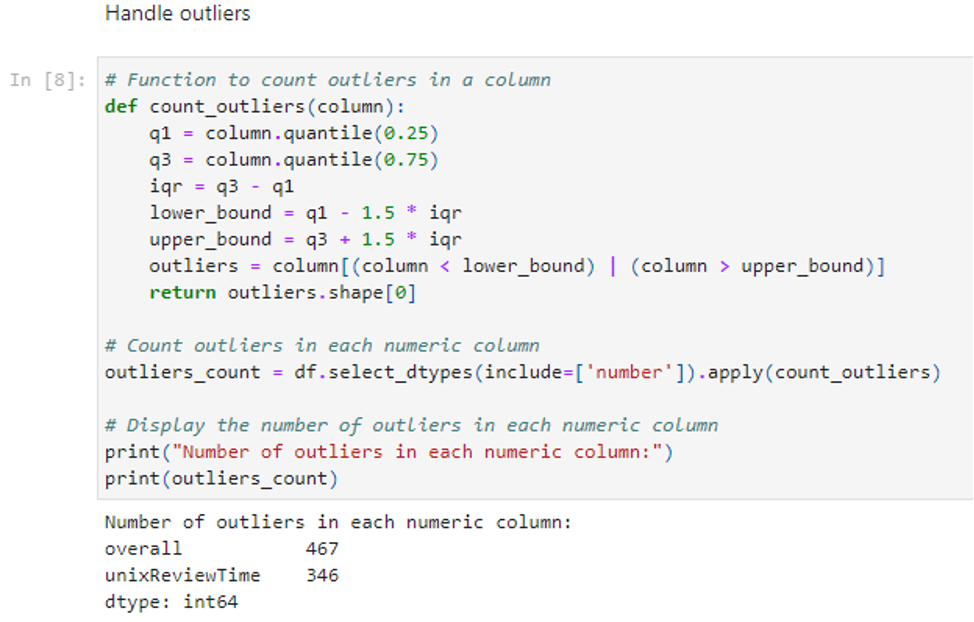
Handling Outliers
In the boxplot method, we found and got rid of outliers in numeric columns ‘overall’ and ‘unixReviewTime.’ From the IQR and out-of-bounds values, we have measured the magnitude of outliers present in the data set.
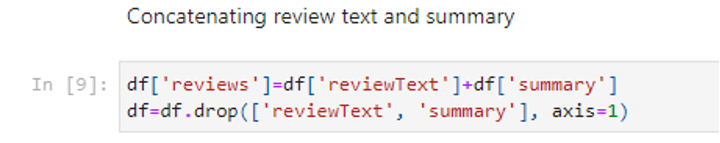
Concatenating Text Columns
The contents of the ‘reviewText’ and ‘summary’ columns were combined. These were then placed in the consolidated ‘reviews’ column. The process merged the text-based features, bringing the content from both columns into one entity. This consolidation makes it easy to analyze and process textual data from the dataset. The column reviews specified on the final dataset have all the necessary data incorporated to allow for comprehension of the lengthy reviews and short summaries.
Feature Engineering
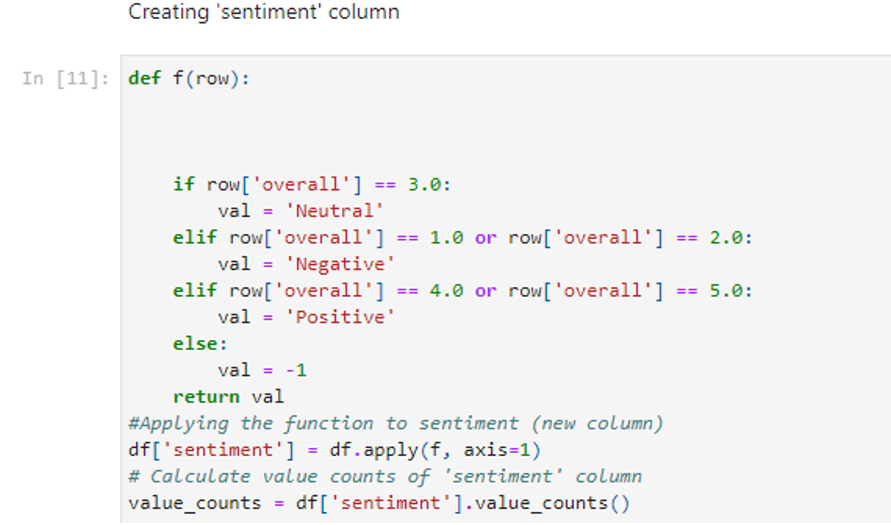
The rest of the data processing we applied is enrichment that will be added to the existing insights to improve the analysis. First, we introduced each review’s sentiments, including positive, negative, or neutral. For this labeling, we used the ‘overall’ values given by the reviewer for measuring, making it possible to catch the underlying sentiment embedded in each review correctly.
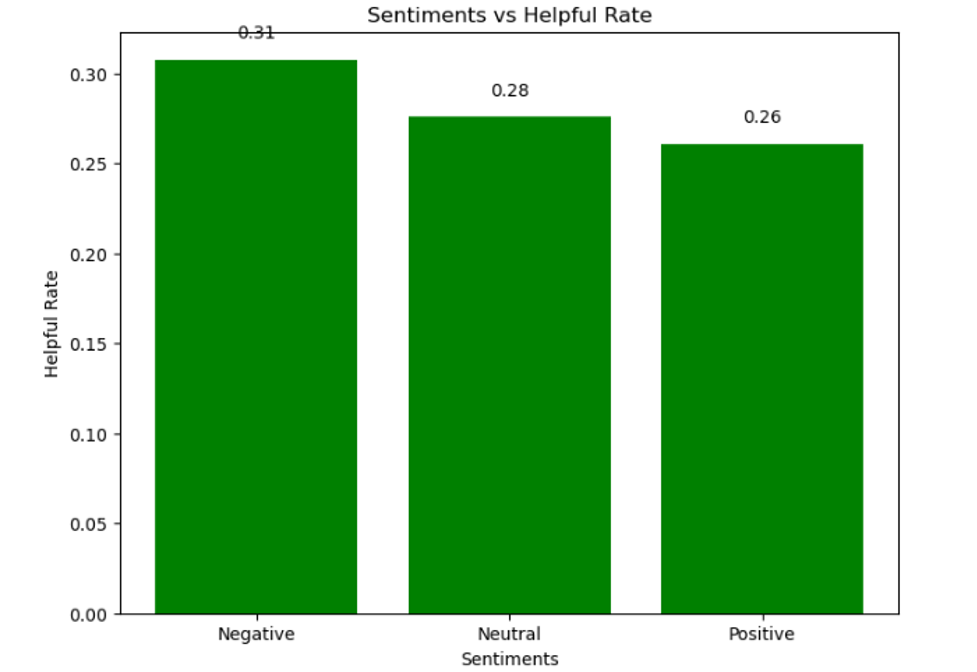
We also added a new property called ‘helpful_rate’ that shows the helpfulness of reviews. That means we have the calculation of the ratio of informative votes to the total votes in this way, meaning that it makes us understand the level of usefulness that every review has to other users.
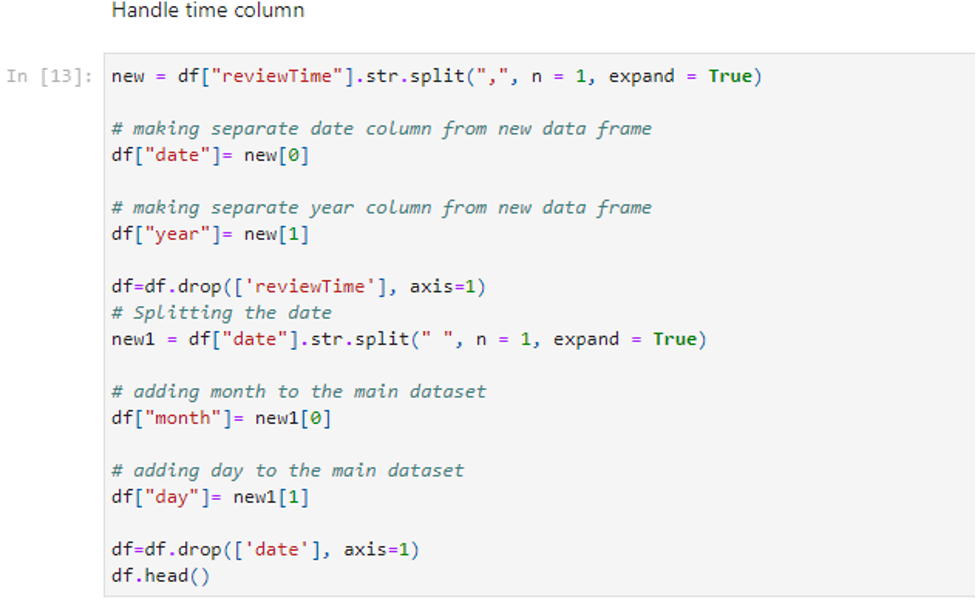
Moreover, we extracted temporal features from the ‘reviewTime’ column to capture the time patterns. From the parsing of date information, attributes can be inferred to consist of ‘year’, ‘month’, and ‘day’. Identifying the features will enable us to explore the trend of periodicity within reviews. Besides, those engineered features are responsible for data seasonality or time shift exposure when analyzing user sentiment or perception toward products. In general, those planned features provide the background for the data, and the model becomes comprehensive.
Finally, we performed Punctuation Cleaning and Stopword removal to obtain only relevant texts for the dataset during training.
Exploratory Data Analysis
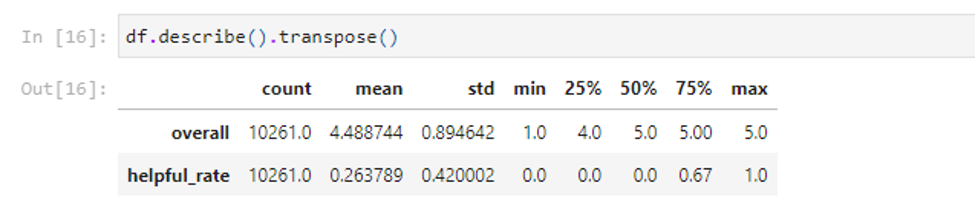
In our exploratory data analysis (EDA), we delved into various aspects of the dataset to glean insights and patterns. Initially, a complete statistical description was conducted for numeric features that summarized most of the essential statistics like mean, standard deviation, quartiles, and extreme values. This gave insight into the data set’s central tendencies and spreads of the numerical variables.
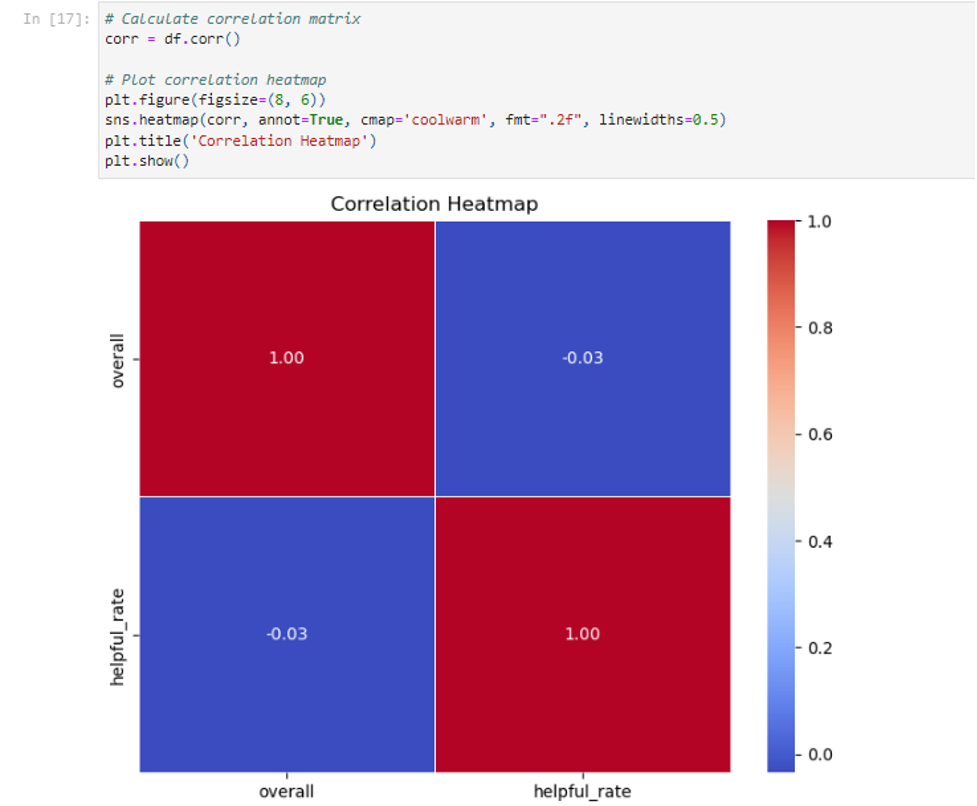
After that, a correlation matrix heatmap was plotted to check relationships between numeric variables. This heatmap is a critical visualization as it shows how the variables are interrelated and whether there are some possible patterns or dependencies within them that can influence the further strategy of analysis and modeling.
We also looked at how sentiments are related to the helpful rates they gain, that is, which sentiment categories are likely to be classified as most and least beneficial by fellow users. This analysis revealed whether the existence of specific sentiment categories leans towards more helpful votes from users and hence proved quite insightful in the influence of sentiment over the reception of reviews.
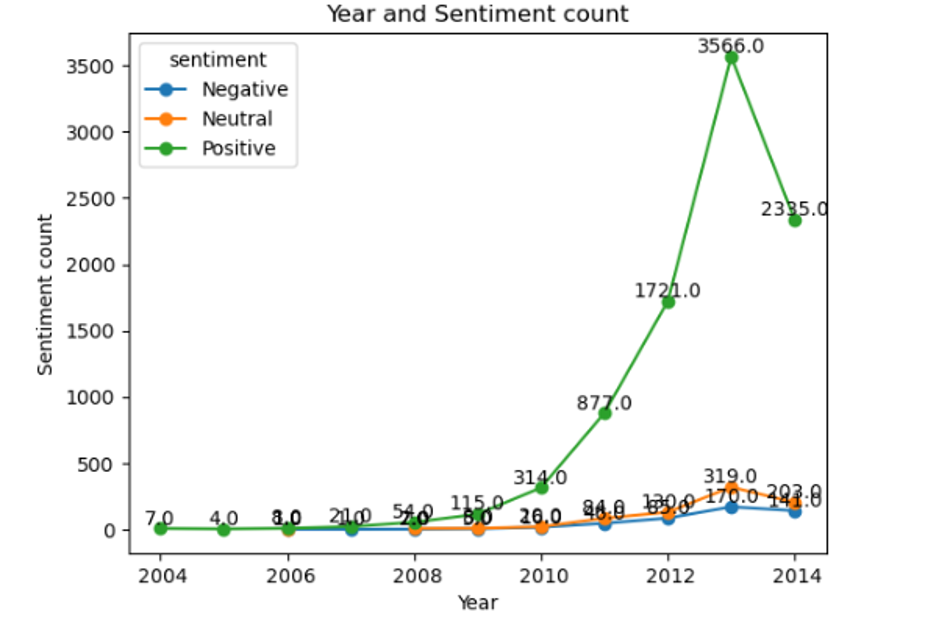
We further study the distribution of sentiment counts concerning different years, hoping to see some temporal trends or shifts in user sentiments through the years. This helps us perceive the distribution of sentiments throughout the years, leading to potential patterns that might identify changes in product perceptions or changes in user experiences.
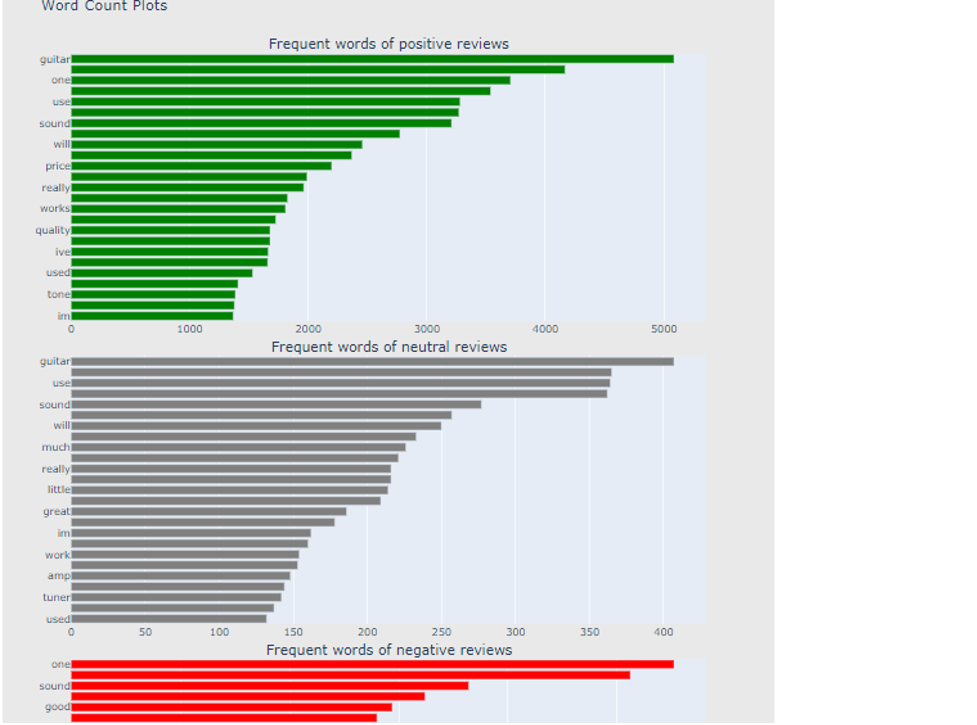
Finally, monogram analysis was done, where the frequency of the word in positive, neutral, and negative reviews was analyzed using n-gram analysis. Through this, we explored the most frequently used words across the sentiment categories, which will give us an additional dimension of qualitative understanding to quantitative analysis of the words the reviewers use based on the classifications of their sentiments. This has added a comprehensive view to our EDA of this dataset, dealing with many aspects of the characteristics of reviews and dynamics.
Model Selection and Hyperparameter Tuning
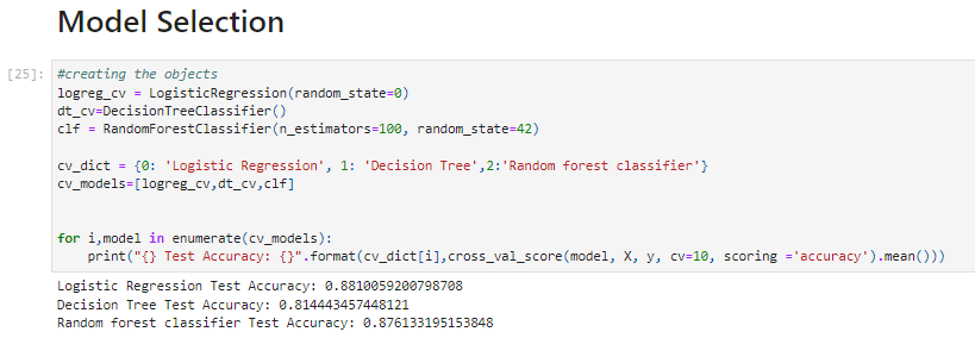
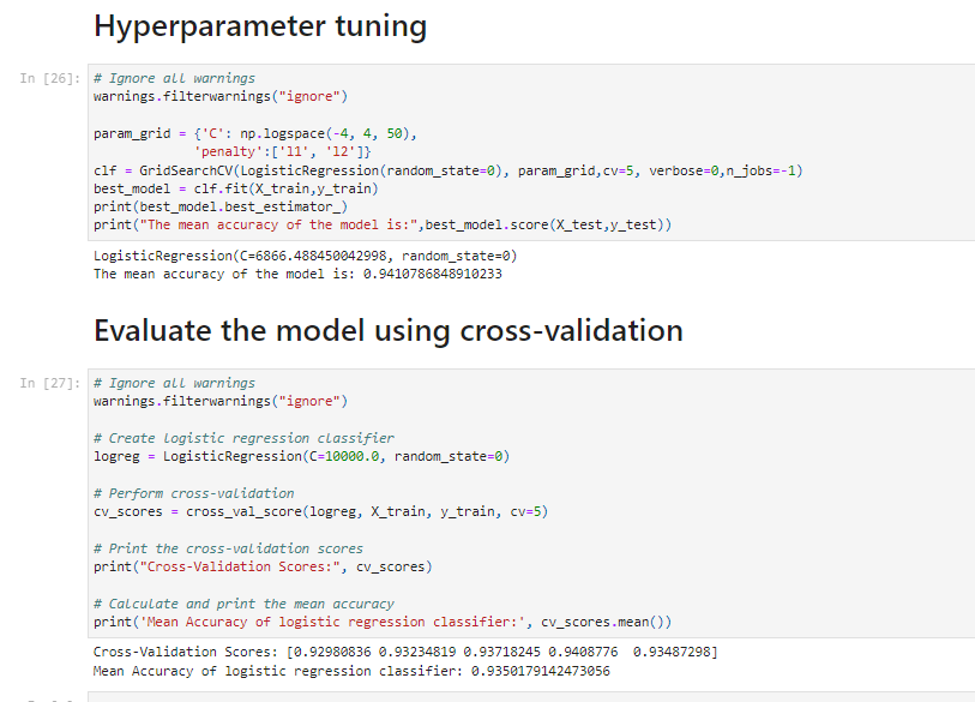
This model selection process is followed for the three types of classification algorithms: Logistic Regression, Decision Tree, and Random Forest Classifier. The second phase of modeling commences after the model selection—hyperparameter tuning. Optimization of the Logistic Regression model in hyperparameters is introduced in the second phase of modeling using the GridSearchCV technique, which systematically looks up the best combination of hyperparameters out of the defined grid of parameters (Yu et al., 2020). This optimizes the model’s parameters to improve how the model makes predictions about the task, consequently leading to better general performance in sentiment classification tasks.
Model Evaluation
We subsequently accessed the model performance with cross-validation, which is robust for assessing how far a model will generalize. We partitioned the dataset into several subsets and trained our model on different combinations, enabling more accurate model performance on different data samples. In particular, mean accuracy was reported as an essential indicator of the Logistic Regression model, which measured the model’s effectiveness in predicting review sentiments accurately (Alantari et al., 2022). The aim is to select the best model for sentiment classification application in practice through these comprehensive evaluation steps with outstanding and robust performance.
Results
After hyperparameter tuning, the logistic regression model had the highest mean accuracy, about 94.11%. Also, the Random Forest Classifier was outperformed with a mean accuracy of approximately 87.61%. These have a high potential result in both models getting sentiment classification right on the dataset. The Logistic Regression model emerged as the best performer, incredibly when fine-tuned, indicating potential applicability to robust sentiment analysis tasks. This shows that more of the model and optimization matter in obtaining high accuracy, besides ensuring that the sentiment classification is reliable.
Discussion
From the discussion, it is clear that the Logistic Regression model was one of the best-performing models with high accuracy in classifying sentiments within the dataset. Having recorded the highest mean accuracy post hyperparameter tuning, the model well-distinguished positive, negative, and neutral sentiments regarding the mentioned features. The indicated success in choosing suitable algorithms is seen in this fact, and Logistic Regression proves itself an approach worthy of trust.
Additionally, feature engineering significantly increased the model performance by giving solid features to the sentiment analysis. The added sentiment labels, helpfulness rates, and time-based features gave robust added information to the model to make it capture sentiment expressed in the reviews more fully.
In addition, the n-gram analysis provided valuable observations regarding the most frequent words within the different sentiment categories. The pattern for making sense of these predictions reveals a proper understanding regarding consumer sentiments for the other musical instruments as reviewed (Duong & Nguyen-Thi, 2021). Overall, these discussions underscore the importance of feature engineering techniques and data analysis methods that improve the performance and interpretability of sentiment analysis models.
Conclusion
In conclusion, the machine learning model gives general success in answering the sentiment analysis task in customer reviews of musical instruments. Logistic Regression, particularly with hyperparameter fine-tuning, has been the best model for accurately discerning sentiments. This exemplifies the applicability of the model in real-life scenarios to understand customer perceptions and feedback on the domain of musical instruments.
There is the possibility for future work to be done with more sophisticated techniques, such as the use of deep learning architectures or ensemble methods that can improve model performance. In addition, for this case, along with domain features like the specifications of the musical instrument and customer demographics, this would provide richer context, which probably will improve the quality of sentiment analysis results. In short, this study forms a firm base for sentiment analysis within the musical instrument domain and much-continued research.
Challenges and Lessons Learned
Missing values and outliers during the project were quite a challenge; thus, efforts to ensure that they were effectively catered for needed to be put in place to avoid skewness in the analysis outcomes. More important is the feature selection and the process of hyperparameter optimization that has been identified as the key influencing factor to the model’s effectiveness, thus calling for a rational approach in the development of the model. Furthermore, the following steps included interpreting results and visualizations to provide insight into the dataset and the model’s behavior. It is evident that in this part of the data science workflow, clear communication and transparent ways of analysis have been taken. The challenges gave excellent lessons regarding the intricacies of pre-processing, tuning models, and interpreting results in machine learning projects.
References
Alantari, H. J., Currim, I. S., Deng, Y., & Singh, S. (2022). An empirical comparison of machine learning methods for text-based sentiment analysis of online consumer reviews. International Journal of Research in Marketing, 39(1), 1-19. https://doi.org/10.1016/j.ijresmar.2021.10.011
Duong, H. T., & Nguyen-Thi, T. A. (2021). A review: preprocessing techniques and data augmentation for sentiment analysis. Computational Social Networks, 8(1), 1-16. https://doi.org/10.1186/s40649-020-00080-x
Malviya, S., Tiwari, A. K., Srivastava, R., & Tiwari, V. (2020). Machine learning techniques for sentiment analysis: A review. SAMRIDDHI: A Journal of Physical Sciences, Engineering and Technology, 12(02), 72-78. https://doi.org/10.18090/samriddhi.v12i02.03
Yu, T., & Zhu, H. (2020). Hyper-parameter optimization: A review of algorithms and applications. arXiv preprint arXiv:2003.05689. https://doi.org/10.48550/arXiv.2003.05689
 write
write