Differences in Survivorship Curves Across Decades:
The survivorship curves for the 1830s and 1880s expose a significant difference in the data set. For example, the older age cohort groups have created that unique difference and feature as the age progresses. The log values in the 70-79 class depreciated significantly from 2.67 to 2.62 in the 1830s and 1880s, respectively. The decrease in the LOG value shows a higher mortality rate at a later age. Alternatively, the 80-89 class had a significant decrease with LOG from 2.95 to 2.23 in the 1830s and 1880s, respectively. Thus, these changes and differences could be attributed to the advancement in healthcare services.
The advancements in medical technology mainly caused the steep decline in the 1880s. For example, better inventions and sound medical practices increased access to good care in the 1880s, contributing to increased life expectancy for the cohort in their 70s and 80s as opposed to those in the 1930s. Additionally, there could have been promising improvements in living conditions and good sanitation among the elderly, which would have reduced mortality rates.
Comparison with Other Survivorship Curves:
The survivorship curves e 1 represent different population categories, which expose similarities and differences. As such, the high decline in the 1880s for the 70-79 and 80-89 age brackets aligns with the findings exposed in Figure 1 for the cohort of improved medical care. However, the fewer differences could have been attributed to the regional infrastructure developments and technology variations from one region to another.
Contrasting the curves with Figure 2 represents Newberry, South Carolina survivorships and exposes the impact of mortality patterns on the population. Healthcare accessibility, socioeconomic factors, and more disease preferences could also cause slight variations. While the data is specific to a cemetery cohort, figure 2 gives a broader view of the population, exposing such variations.
Impact of Modern Cohort on Data
If the cemetery data were still open in a way that could be accessed well today, the data would likely expose an increased life expectancy rate across all the age cohorts. For example, the 70-79 and 80-89 who had higher mortality rates could be experiencing a lower mortality rate. The improved medical care and more advancements in the medical field have impacted the data positively. The infant mortality rate of the aged 0-9 has significantly dropped over time. Thus, this implies that the modern survivorship curve will be rectangular to show a decline in mortality rates.
Hypothesis
The hypothesis of the modern cohort, such as the 20th century, will show a decreased mortality rate across the cohorts. The vast difference in mortality rates, as expected in the 1830s and 1880s data, will support the data. The hypothesis assumes that the developed and advanced medical care improved the state of life, contributing to increased life expectancy. As such, if this trend continues, there is an expected extension of the curve, which shows more evidence for even lower mortality rates.
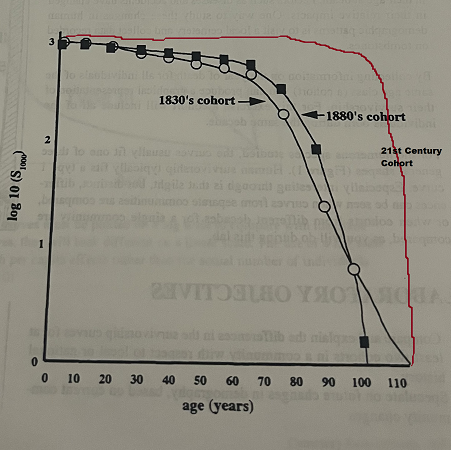
Figure 1: 1830s, 1880s and 21st Century Cohort
Changes in 1940’s Survivorship Curve
A survivorship curve for the 1940s would still show reduced mortality rates as per the context of this data set. As such, the data might be close to that of the 1880s, but the LOG values will be higher. For example, the LOG of the 1880s was 2.23, and that of the 1940s could be higher because of the changes that could have happened in the healthcare sector. The infant mortality data will also show similar features; however, the rate will not be the same.
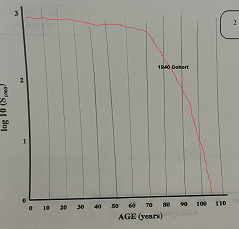
Figure 2: 1940s Cohort Data
Speculations about the Future:
- A) In the future, there are speculations that people might resist vaccines, leading to more refusal. As such, there is an expected increase in mortality rates in the future times. Thus, the 0-9 cohort might experience a steeper decline in the curve.
- B) The increased medical advancements are expected to have a significant positive impact on mortality rates. As such, the infant mortality rates will likely reduce by a wider margin. The primary reason is healthcare advancement, and most of the diseases will be eliminated.
- C) Environmental problems are another critical factor in the survivorship curve. For example, if environmental problems like pollution aren’t solved, then the rates of mortality will experience an upward trend. This will be evident in the higher age groups of 70-79 and 80-89 because of the factors related to their old age health
Summary and Hypothesis Evaluation:
The hypothesis of this evaluation has been validated by the differences among the small age groups over the decades. For instance, the steeper decline in the curve In the 1880s from the 70-79 and 80-89 age is because of the expectation of improved access to medical facilities. As shown in curves, these patterns have been showing advancements from the age brackets. The improvements could be noted as time progressed more significantly in the 70-79 and 80-89 age brackets because they are prone to high cases of mortality in any population cohort. Alternatively, better healthcare facilities’ technological access and other significant factors supported the 0-9 age bracket findings (Statistica). The infants could receive consistent and good vaccines that controlled most diseases, lowering the mortality rate. Therefore, supporting the existing verdict in the argument exposed from the findings listed from the data set.
Beyond the data supplied, research on local history and medical advancements in the particular area of the cemetery data could improve our comprehension of these patterns, particularly in supplementing the evidence presented in the 1830s and 1880s data variations. The impact has also been truncated to the expectations in the 20th century because of the relationship to healthcare development and advancements globally (Statistica). Socioeconomic and cultural factors may also shape the survivorship curves. However, there were some notable differences in some areas, especially the LOG values that could depict that. The differences were significantly noted from the unbalanced developments across some regions. More investigation into these areas may yield a more thorough explanation for the trends that have been noticed. Consequently, assessing the data from many other regions will enrich the context depicted in the curves and the data set. Therefore, this analysis is very relatable to what was happening over the decades in the 1830s and 1880s when well comprehended with the current expectations in the modern world.
Work Cited
Statistica. “United States: Child mortality rate 1800-2020.” Statista, 17 June 2019, www.statista.com/statistics/1041693/united-states-all-time-child-mortality-rate/. Accessed 20 Feb. 2024.
 write
write