Introduction
We perceive an acceptable goal in the fact that we explore long-time crime trends in the states of Missouri, Massachusetts, and the United States. The base of crime statistics in the United States since it was established in 1929 by the International Association of Chiefs of Police, the United Crime Reporting (UCR) program is the source of information in the present analysis. A nationwide effort under the auspice of the United Crime Reporting (UCR) program, overseen by the Federal Bureau of Investigation (FBI), aims to bring applications of statistical methods to crime reduction (Cochran & Worden.,2022). It accumulates information on criminal behaviours from over 18000 local police in all states of the United to calculate estimated annual crime statistics. What stands out is that the figures gathered by the UCR program are vital for governors in the strategic planning of law enforcement or crime-control issues.
Since the UCR data is produced only from reported incidents, it can provide specific records of offences, not crimes that may have been unreported. In this regard, your knowledge must be sincere. “Dark figure of crime” is commonly used for this problem, and we cannot see people committing crimes in various ways (Eisen & Eisen.,2023). This is accessible because they may never reach investigators. People have different reasons for not reporting a crime, which might be their distrust of police, fear for their safety, and belief that the crime is not worthy or of sufficient weight.
From the perspective of the UCR framework, criminals perpetrate either “Part I” or “Part II” offences. Property crimes, including burglary, larceny-theft, motor vehicle theft, and arson, fall under Part I, which is described as more severe crimes and includes murder, rape, robbery, and aggravated assault. As a result of the potential hurt or enormous financial damage that these crimes potentially inflict, they are seen as more severe.
Separately, Part II offences include a broader range of less serious transgressions, such as simple assault, fraud, drug abuse penalties, disorderly conduct, and vandalism. Part II offences are nevertheless criminal despite the common perception that they are less severe than Part I. The consistency and comparability of statistics from different periods may be impacted because some crimes have had their definitions modified throughout the years. After the definition was revised in 2013 to include a broader range of sexual assaults, for instance, it seems that the number of rape cases recorded rose.
Results
Violent Crime Rates in MA and MI (2015-2019)
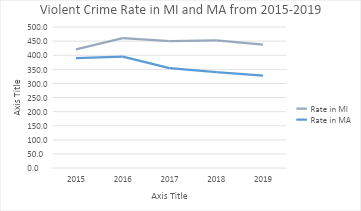
Violent crime rates in Massachusetts and Missouri vary significantly, as seen from 2015 to 2019 data. The violent crime rate in Massachusetts was consistently lower than that in Missouri over the five years. In 2015, Missouri had 420.6 occurrences per 100,000 people, compared to 389.9 in Massachusetts. From a 2016 peak of 460.9 per 100,000 to a 2019 low of 437.4 per 100,000, Missouri’s violent crime rate fluctuated during the subsequent years. Despite this decrease, Missouri’s average violent crime rate was quite high at 444.3 occurrences per 100,000 persons over the analyzed period.
Contrarily, Massachusetts’ violent crime rate has been declining over the last few years, dropping from 389.9 per 100,000 in 2015 to 327.6 in 2019, a decline of 16%. Compared to Missouri, where the average number of violent crime incidents per 100,000 inhabitants is 361.5, Massachusetts had a much lower rate over this time. According to the different trends in these two states, violent crime has steadily declined, suggesting that Massachusetts may have implemented effective legislation or strategies to address this issue. In contrast, Missouri’s consistently elevated rates of violent crime need a more concerted effort to combat the problem via the deployment of resources and the introduction of focused initiatives.
Property Crime Rates in MA and MI (2015-2019)
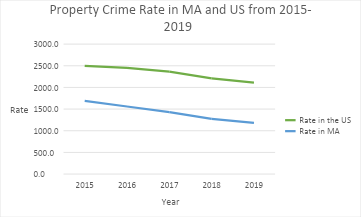
From 2015 to 2019, the trends in violent crime and property crime rates in Massachusetts and Missouri differ. Both states saw substantial drops in property crime rates over this period. However, the reductions were not identical. The property crime rate in Massachusetts was 1,688.4 per 100,000 persons in 2015, whereas in Missouri, it was 1,927.8. With a 17.8 per cent decrease, the 2019 incidence rate in Missouri was 1,585.0 per 100,000 persons. Nevertheless, subsequent years saw a more gradual deterioration.
The property crime rate in Massachusetts fell by 30.1% between 2015 and 2019, going from 1,688.4 to 1,179.8 per 100,000 persons. Over the specified period, Massachusetts had lower property crime rates than Missouri. Massachusetts had a lower property crime rate (1,425.8 per 100,000) than Missouri (1,779.0 per 100,000) for the same time frame. This comparison suggests that, at this time, Massachusetts’ laws and strategies may have been more successful in decreasing property crimes. While both states have witnessed a decline in crime overall, Missouri’s higher rates of property crime indicate that the state still has a ways to go before it can resolve this problem. This effort may include reallocating funds to address the root causes of property crimes.
Robbery Rates in MA and MI (2015-2019)
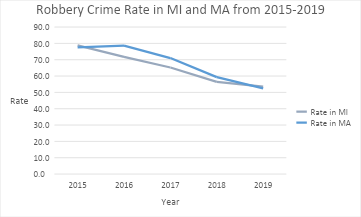
Massachusetts and Missouri both saw significant drops in robbery rates between 2015 and 2019, which is a subset of violent crime. From 77.6 per 100,000 in 2015 to 52.4 in 2019, the robbery rate in Massachusetts fell 32.5%. From 78.8 occurrences per 100,000 people in 2015 to 53.6 in 2019, the robbery rate in Missouri fell by 32%. Although both states’ robbery rates were similar at the start of the research period, Massachusetts’ rate remained somewhat lower than Missouri’s average of 65.2 occurrences per 100,000 inhabitants throughout the five years.
Motor Vehicle Theft Rates in MA and MI (2015-2019)
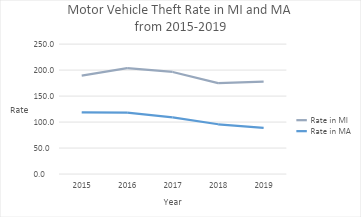
Motor vehicle theft rates exhibited divergent patterns in Massachusetts and Missouri from 2015 to 2019. In Massachusetts, the rate dropped by 25%, decreasing from 118.6 incidents per 100,000 population in 2015 to 89.0 in 2019. Conversely, Missouri experienced a more modest 6.3% decrease, declining its motor vehicle theft rate from 189.5 incidents per 100,000 population in 2015 to 177.7 in 2019. Notably, Missouri consistently maintained higher motor vehicle theft rates compared to Massachusetts throughout the study period, with an average rate of 188.5 incidents per 100,000 population versus Massachusetts’s average of 106.2.
Violent Crime Rates in the US and MA (2015-2019)
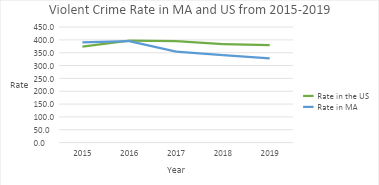
There are noticeable patterns when looking at violent crime statistics in the US and Massachusetts. In contrast to the national violent crime rate, which rose by 1.5% between 2015 and 2019, Massachusetts’ rate fell by a significant 16%. Massachusetts had a lower violent crime rate than the rest of the country for the five years (361.5% vs. 361.5%). Massachusetts may have taken a different approach than the rest of the country regarding violent crime prevention during this period based on these divergent tendencies.
Property Crime Rates in the US and MA (2015-2019)
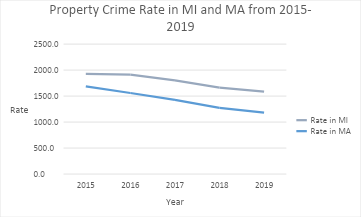
From 2015 to 2019, property crime rates in the USA and MA decreased significantly. The national property crime rate decreased by 15.6% between 2015 and 2019, going from 2,500.5 to 2,109.9 incidents per 100,000 people. In 2019, there were 1,179.8 incidents per 100,000 inhabitants in Massachusetts, a reduction of 30.1% from 1,688.4 in 2015. During the study period, the property crime rate in Massachusetts was 1,425.8 incidents per 100,000 inhabitants, which was lower than the national average of 2,327.0. However, in both sectors, there was an overall declining tendency.
Conclusion
Using Uniform Crime Reporting (UCR) data, this research brief aimed to analyze the crime rate in the United States, Missouri, and Massachusetts from 2015 to 2019. This brief classified a wide range of crimes, from general categories like burglary and assault to more narrow ones like car theft and robbery, so that readers may have a clearer idea of the criminal climate in these three regions.
According to statistics, states, territories, and the state of Missouri in the United States have wildly different crime rates. The success of anti-violence programs may account for the 16% decline in violent crime in Massachusetts from 2015 to 2019, a figure far lower than the US average. Violent crime in Missouri remains a problem despite a little 4% uptick. The national and Massachusetts averages are much lower than this state’s rates.
Whatever the case, the property crime rates in all three areas have been down for some time. The steepest decline was in Massachusetts, at 30.1%, followed by the United States at 15.6%, and Missouri at 17.8%, out of the 50 states. The research found that property crime rates in Missouri were consistently higher than the national average. Therefore, more money is needed for this sector despite these encouraging improvements.
According to these statistics, more work is required, especially to address regional disparities and ongoing criminal problems, even if there has been significant success in decreasing certain forms of criminal conduct. Take Missouri as an example. The alarming rise in violent and property crimes highlights the vital need for more cooperation between communities, governments, and police forces in order to address this issue. Despite significant declines across the board, many subcategories, like robbery and vehicle theft, have shown persistently higher rates in Missouri than in Massachusetts. Considering the gap, Missouri can reduce car theft via targeted crime prevention programs.
Remember that only offences formally reported to the police are offences on which to use the UCR data. Consider this carefully. They can be affected greatly, so many criminals may not be punished. An additional concern is connected to the fact that it is more problematic to have comprehensive programs for crime and distribute resources equally, as some crimes might be covered up. Changing definitions of criminal offence is already hard to implement without requiring a risk of making the information consistent and comparable. Acknowledges the focal point or key is detailed research work on similar cases and trends. To ensure that the standard responds to the changing landscape of criminal actions and recent public worries, the UCR program may need to be more proactive.
Investing in data strategies like replacing or upgrading reporting platforms and ensuring data quality against underreporting and bias are keystones for improvement. All the factors above ultimately threaten the likelihood of fundamentally sound UCR data. Consequently, faith in the police and reporting crime would be more. However, this would mean that the “dark figure of crime” will disappear, and the campaign against crime will be waged in reality rather than in the figures.
The program may need to ensure that risk assessment tools in the UCR program are tailor-made for the new offenders engaged in cybercrime, hate, or opioid crimes. Lawmakers, academics, and law enforcement agencies will have access to UCR data, which will aid in improving public safety by enabling stakeholders to identify root causes and develop effective strategies that could help manage the rising number of chronic crime cases.
References
Cochran, H., & Worden, R. E. (2022). Beyond impunity: An evaluation of New York State’s nonfatal shooting initiative. Criminology & Public Policy, 21(2), 235-271.https://doi.org/10.1111/1745-9133.12584
Eisen, L., & Eisen, R. J. (2023). Changes in the geographic distribution of the black-legged tick, Ixodes scapularis, in the United States. Ticks and tick-borne diseases, 14(6), 102233. https://doi.org/10.1016/j.ttbdis.2023.102233
 write
write